ECO 251 FORMULA LIST
advertisement
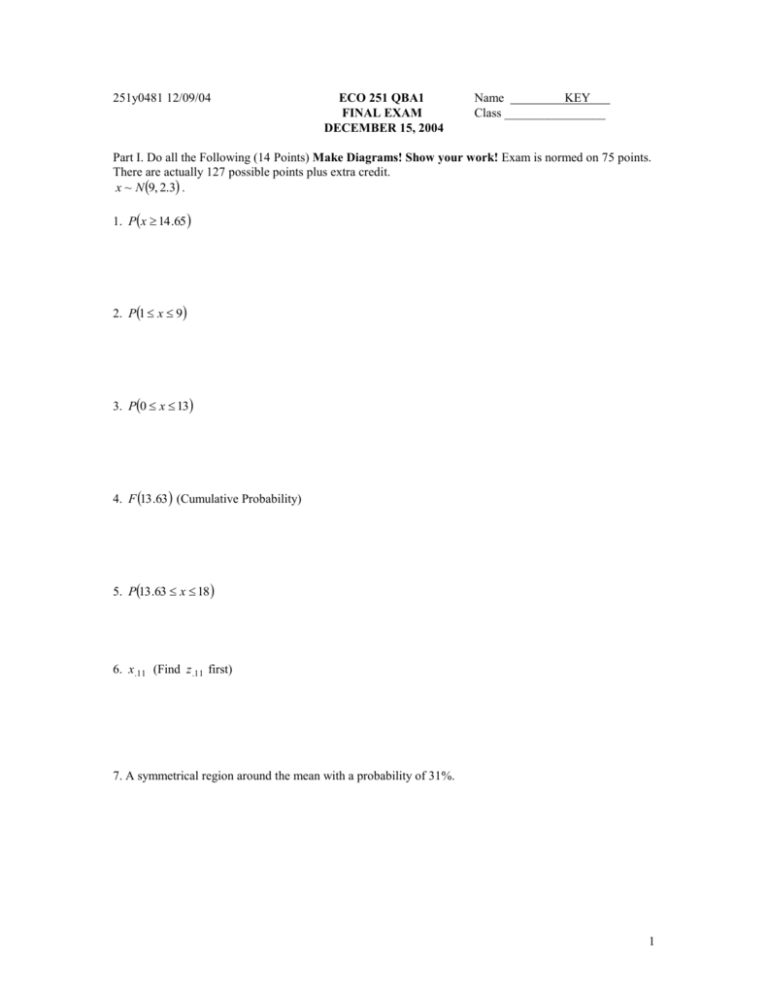
251y0481 12/09/04 ECO 251 QBA1 FINAL EXAM DECEMBER 15, 2004 Name KEY Class ________________ Part I. Do all the Following (14 Points) Make Diagrams! Show your work! Exam is normed on 75 points. There are actually 127 possible points plus extra credit. x ~ N 9, 2.3 . 1. Px 14 .65 2. P1 x 9 3. P0 x 13 4. F 13 .63 (Cumulative Probability) 5. P13 .63 x 18 6. x.11 (Find z .11 first) 7. A symmetrical region around the mean with a probability of 31%. 1 251y0481 12/09/04 II. (10 points+-2 point penalty for not trying part a .) Show your work! (Example modified from Hildebrand, Ott and Gray) Row 1 2 3 4 5 6 7 8 9 10 x x2 y y2 4.0 16.00 10.1 102.01 4.5 20.25 10.3 106.09 5.0 25.00 10.4 108.16 5.5 30.25 21.7 470.89 6.0 36.00 36.7 1346.89 6.5 42.25 51.5 2652.25 7.0 49.00 67.0 4489.00 7.5 56.25 68.5 4692.25 8.0 64.00 68.2 4651.24 8.5 72.25 69.3 4802.49 62.5 411.25 413.7 23421.27 The data above represents intensity of advertising x , measured in number of exposures on evenings of prime time TV, and y , the intensity of awareness of the product according to a consumer survey taken after the advertising campaign. Calculate the following. a. The sample standard deviation s y of awareness. (The standard deviation of x is 26.4712) (2) b. The sample covariance s xy between x and y . (3) c. The sample correlation rxy between x and y . (2) d. Given the size and sign of the correlation, what conclusion might you draw on the relation between x and y ? (1) e. Assume that the intensity of awareness was 10% higher ( v 1.1y ). Find v , s v2 , s xv , and rxv . Use only the values you computed in a-c and rules for functions of x and y to get your results. If you state the results without explaining why, or change x and y and recompute the results, you will receive no credit. (4).[12] 2 251y0481 12/09/04 III. Do at least 5 of the following 7 Problems (at least 12 each) (or do sections adding to at least 51 points Anything extra you do helps, and grades wrap around) . Show your work! Please indicate clearly what sections of the problem you are answering! If you are following a rule like E ax aEx please state it! If you are using a formula, state it! If you answer a 'yes' or 'no' question, explain why! If you are using the Poisson or Binomial table, state things like n , p or the mean. Avoid crossing out answers that you think are inappropriate - you might get partial credit. Choose the problems that you do carefully – most of us are unlikely to be able to do more than half of the entire possible credit in this section!) This is not an opinion questionnaire. Answers without reasons or supporting calculations or table references will not be accepted!!!! 1. Find the following: P3 x 10 for the following distributions. a. Normal with a mean of 6.5 and a standard deviation of 3 (1) b. Continuous uniform with c 4 and d 12 . (2) c. Binomial with n 25 p .25 (2) d. Binomial with n 25 p .75 (2) e. Geometric with p .01 (2) f . Poisson with parameter of 8 (2) g. Px 2 for the Hypergeometric distribution with N 25 , M 6, and n 4. (3)[14] 3 251y0481 12/09/04 2. Find the following: The mean and standard deviation for a. Continuous uniform with c 4 and d 12 . (1) b. Binomial with n 25 p .25 (1) c. Geometric with p .01 (1) f . Poisson with parameter of 8 (1) g. Hypergeometric distribution with N 25 , M 6, and n 4. (1) h. You wish to find P3 x 8 for the binomial distribution with n 75 and p .02 . If you cannot find an appropriate Binomial table, show that you can use an approximation and do the problem using that approximation. (4) i. You are taking a sample of 100 from a population of 300 that is 10% defective and want to find the probability of more than 25 defective items in your sample. You will have to use a Normal approximation. Show, using criteria from a related distribution that you can use the Normal distribution and find the solution. (4) [13] 4 251y0481 12/09/04 3. A random sample was taken of the time necessary for a firm to approve 25 life insurance policies. The sample mean was 43 days and the sample standard deviation was 24 days. Assume that the underlying distribution is Normal. a. Assuming that the sample of 25 was taken from a large number of policies, find a 99% confidence interval for the mean processing time. (4) b. Assume that the sample of 25 was taken from 400 policies, find a 99% confidence interval for the mean processing time. (4) c. Assume that we know that the population standard deviation was 20 days, but that our sample mean came from a sample of 25 taken from 400 policies, find a 99% confidence interval for the mean processing time. (4) [12] 5 251y0481 12/09/04 4. A supermarket clerk is believed to take a mean time of 2.5 minutes with a standard deviation of 2.1 minutes to check out one person. Assume that the underlying distribution is Normal. a. If five people come to this clerk, what is the probability that at least 3 of them will take more than 2.5 minutes? (2) c. What is the probability that the clerk will take more than 2.6 minutes to check out one individual? (2) b. If 3 people come to this clerk, what is the probability that at least 2 of them will take more than 2.6 minutes? (2) c. If 3 people come to this clerk, what is the probability that their average checkout time will take more than 2.6 minutes (3) d. This clerk is the only clerk in the store, and the clerk goes on break in 16 minutes. What is the probability that the clerk will be able to check out the 6 people lined up at the clerk’s station before the clerk goes on break? (3) e. Suppose that a firm has revenues of x and costs of y , so that profits are a random variable w x y . Will a larger correlation between revenues and costs, (i) increase, decrease or not affect the expected value of profits? (ii) increase, decrease or not affect the variability of the profits? (Be careful – show what formula you are using) Why? Guesses are not acceptable. (3) [13] 6 251y0481 12/09/04 5. (Example modified from Hildebrand, Ott and Gray) A trust officer of a bank estimates the joint probabilities for percent return on two utility bonds as shown on the table below. For your convenience, sums of rows and columns are given in the first table and xyPx, y and sums of xyPx, y columns, which you do not need, but will shorten your work tremendously, in the next table. xyPx, y and column sums Original Data x 8 y 9 .04 .06 .08 .04 .00 10 .03 .06 .20 .06 .03 11 .00 .04 .08 .06 .04 8 9 10 11 12 .03 .04 .02 .00 .00 sum .09 .22 .38 .22 sum 12 .00 .00 .20 .04 .09 ..22 .38 .22 1.92 2.88 2.88 4.86 2.40 5.40 0.00 3.96 0.00 0.00 1.60 0.00 0.00 7.20 20 .00 3.96 6.60 0.00 3.60 8.80 7.26 5.28 2.40 5.28 6.40 18 .90 38 .00 25 .30 Note that E x 10 and x2 1.16 a. If x and y are independent, what would the number be in the blank space in the original joint probability table (1) b. What should the number be in the blank space in the joint probability table? Fill it and the remainder of the numbers in. (2) c. Compute y and the standard deviation of y (2) d. Compute xy Covx, y and xy Corrx, y (4) f. Compute Ex y and Var x y (2) g. If the officer buys two units of bond x and three units of bond y , so that the total return is 2x 3 y , what is the mean and standard deviation of the total return? (4)[15] 7 251y0481 12/09/04 6. Take the following joint probability table and find a. P A1 B1 (1) b. P A1 B1 (2) c. P A1 B1 (2) B1 A1 A2 A3 B2 B3 .05 .15 .50 .05 .05 .00 .20 .00 .00 .70 .10 .20 .30 .20 .50 Fill in the blanks on the following tables on the assumptions given. (2 each) d. A1 and B1 are mutually exclusive. B1 B 2 B 3 e. A1 and B1 are independent. A1 A2 A1 .05 .30 A2 .0500 A3 .15 .10 .45 A3 .1375 .1750 B1 .45 .30 . B2 B3 f. A1 and B1 are collectively exhaustive B1 B 2 B 3 .30 A1 A2 .00 .05 .45 A3 .00 .00 .20 .4500 .3000 .20 .50 g. (Ben-Horim and Levy) The senate is about to vote on a tax bill. There is a 40% chance that it will pass. If it passes, there is a 15% chance that unemployment will increase in the next 6 months. If it does not pass, there is a 55% chance that unemployment will increase. Use the following notation: Event TP is the event that the bill passes; Event UI is the event that unemployment increases. Find the probability that unemployment will increase in the next 6 months. (2) h. You were out hunting minces (You make mince pie from them.) in Banji-Wanjiland and did not find out whether the tax bill passed. When you get home you find out thay unemployment has increased. What is the (posterior) probability that the tax bill passed? (3) [16] PTP .40 P TP .60 P UI TP .15 P UI TP .55 PUI PUI TP PTP P UI TP P TP .15.40 .55.60 .39 PTP UI PUI TP .15.40 .1538 PUI .39 8 251y0481 12/09/04 7. a. Assume that the average number of workers logging onto a system every hour is 720. (i)What is the chance that none will log on in thirty seconds? (ii) in one minute? (iii) in a half hour? (6) b. A shipment of 16 items is 25% defective. To decide whether to accept it you will take a sample of three items and will reject the shipment if more than one item in your sample is defective. What is the probability that you will reject the shipment? (3) c. A large shipment (over 80 items) is 25% defective. To decide whether to accept it you will take a sample of three items and will reject the shipment if more than one item in your sample is defective. What is the probability that you will reject the shipment? (Do not assume that there is any specific number of items in the shipment.) (3) Note: You will find that parts d) and e) are solved in quite different ways. d. A large shipment is 25% defective. To decide whether to accept it you will take a sample of thirty items and will reject the shipment if more than three items in your sample are defective. What is the probability that you will reject the shipment? (Do not assume that there is any specific number of items in the shipment.) (3) e. A large shipment is 1% defective. To decide whether to accept it you will take a sample of thirty items and will reject the shipment if more than three items in your sample are defective. What is the probability that you will reject the shipment? (Do not assume that there is any specific number of items in the shipment.) (3) [18] 9 10
