Appendix Table 1: Parameter estimates from unadjusted
advertisement
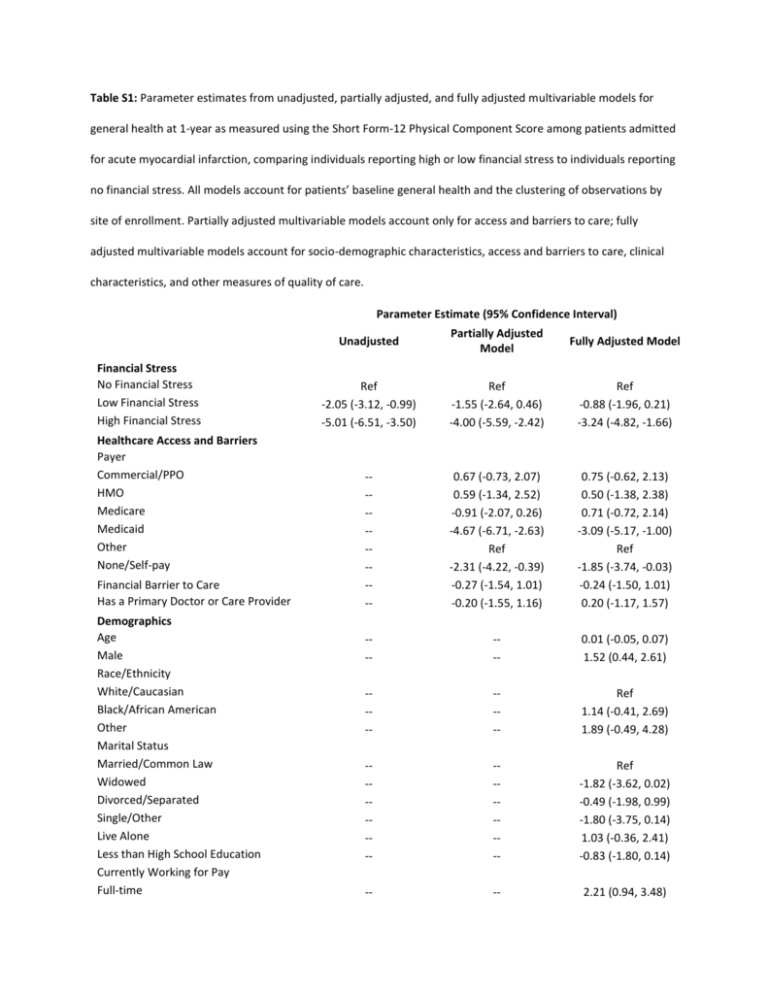
Table S1: Parameter estimates from unadjusted, partially adjusted, and fully adjusted multivariable models for general health at 1-year as measured using the Short Form-12 Physical Component Score among patients admitted for acute myocardial infarction, comparing individuals reporting high or low financial stress to individuals reporting no financial stress. All models account for patients’ baseline general health and the clustering of observations by site of enrollment. Partially adjusted multivariable models account only for access and barriers to care; fully adjusted multivariable models account for socio-demographic characteristics, access and barriers to care, clinical characteristics, and other measures of quality of care. Parameter Estimate (95% Confidence Interval) Financial Stress No Financial Stress Low Financial Stress High Financial Stress Healthcare Access and Barriers Payer Commercial/PPO HMO Medicare Medicaid Other None/Self-pay Financial Barrier to Care Has a Primary Doctor or Care Provider Demographics Age Male Race/Ethnicity White/Caucasian Black/African American Other Marital Status Married/Common Law Widowed Divorced/Separated Single/Other Live Alone Less than High School Education Currently Working for Pay Full-time Unadjusted Partially Adjusted Model Fully Adjusted Model Ref -2.05 (-3.12, -0.99) -5.01 (-6.51, -3.50) Ref -1.55 (-2.64, 0.46) -4.00 (-5.59, -2.42) Ref -0.88 (-1.96, 0.21) -3.24 (-4.82, -1.66) --------- 0.67 (-0.73, 2.07) 0.59 (-1.34, 2.52) -0.91 (-2.07, 0.26) -4.67 (-6.71, -2.63) Ref -2.31 (-4.22, -0.39) -0.27 (-1.54, 1.01) -0.20 (-1.55, 1.16) 0.75 (-0.62, 2.13) 0.50 (-1.38, 2.38) 0.71 (-0.72, 2.14) -3.09 (-5.17, -1.00) Ref -1.85 (-3.74, -0.03) -0.24 (-1.50, 1.01) 0.20 (-1.17, 1.57) --- --- 0.01 (-0.05, 0.07) 1.52 (0.44, 2.61) ---- ---- Ref 1.14 (-0.41, 2.69) 1.89 (-0.49, 4.28) ------- ------- Ref -1.82 (-3.62, 0.02) -0.49 (-1.98, 0.99) -1.80 (-3.75, 0.14) 1.03 (-0.36, 2.41) -0.83 (-1.80, 0.14) -- -- 2.21 (0.94, 3.48) Part-time Not currently working for pay --- --- 0.64 (-1.06, 2.35) Ref -------- -------- -0.85 (-2.00, 0.30) -0.13 (-0.20, -0.05) -0.62 (-2.57, 1.33) -0.62 (-1.73, 0.49) -0.55 (-1.56, 0.46) -1.32 (-3.47, 0.83) -1.38 (-2.90, 0.13) -- -- -2.60 (-4.68, -0.51) Anti-Depressant Medication Prescribed at Discharge -- -- 1.08 (-0.96, 3.12) Cardiac History Prior AMI Prior Congestive Heart Failure Prior PAD ---- ---- -1.72 (-2.81, -0.63) -2.75 (-4.58, -0.91) -3.34 (-5.24, -1.44) Acute Presentation Other Acute Non-Cardiac Condition at Presentation -- -- -2.83 (-5.45, -0.20) Final AMI Study Diagnosis STEMI NSTEMI Primary Reperfusion Left Ventricular Systolic Function <40% ----- ----- -0.03 (-1.26, 1.19) ref -0.42 (-1.68, 0.83) -1.40 (-2.61, -0.20) Non-Cardiac History Smoked within Last 30 Days Obese (BMI > 30) Chronic Renal Failure Diabetes Hypertension History of CVA History of Pulmonary Disease Use of Anti-Depressant Medication on Admission Quality of Care Measures Number of Eligible Indicators Received --0.13 (-0.38, 0.64) Percent of Eligible Indicators Received --0.01 (-0.02, 0.04) Note: BMI=Body Mass Index; AMI=Acute Myocardial Infarction; STEMI=ST-segment Elevation Myocardial Infarction; NSTEMI=Non-ST-segment Elevation Myocardial Infarction.

