PS #2 supplement
advertisement
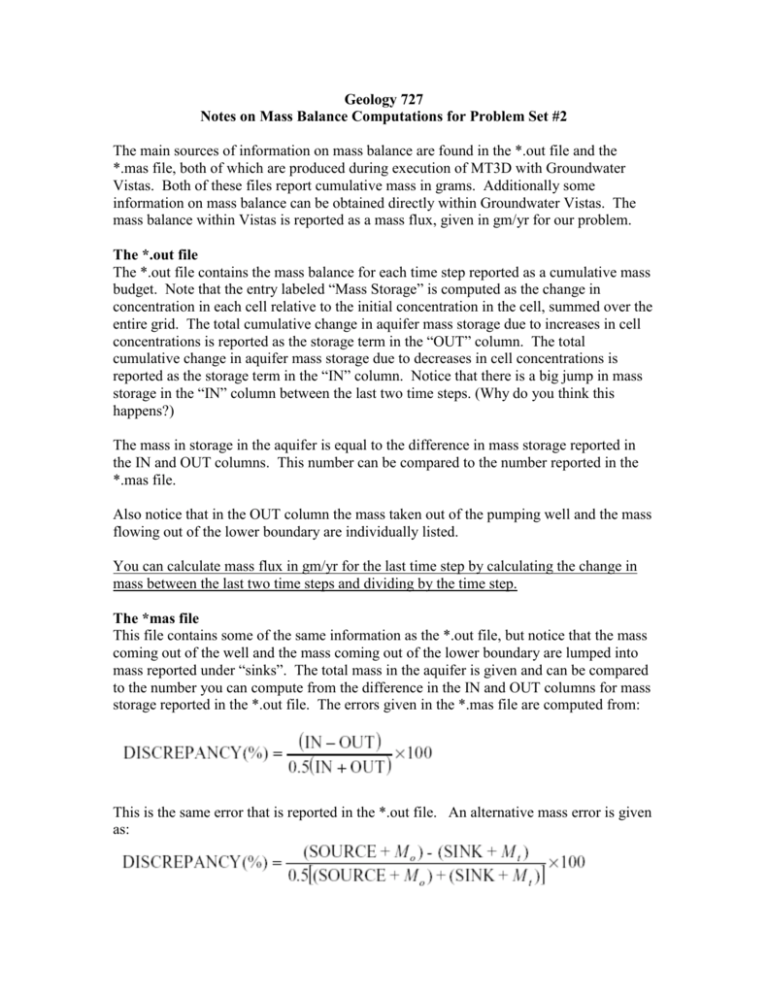
Geology 727 Notes on Mass Balance Computations for Problem Set #2 The main sources of information on mass balance are found in the *.out file and the *.mas file, both of which are produced during execution of MT3D with Groundwater Vistas. Both of these files report cumulative mass in grams. Additionally some information on mass balance can be obtained directly within Groundwater Vistas. The mass balance within Vistas is reported as a mass flux, given in gm/yr for our problem. The *.out file The *.out file contains the mass balance for each time step reported as a cumulative mass budget. Note that the entry labeled “Mass Storage” is computed as the change in concentration in each cell relative to the initial concentration in the cell, summed over the entire grid. The total cumulative change in aquifer mass storage due to increases in cell concentrations is reported as the storage term in the “OUT” column. The total cumulative change in aquifer mass storage due to decreases in cell concentrations is reported as the storage term in the “IN” column. Notice that there is a big jump in mass storage in the “IN” column between the last two time steps. (Why do you think this happens?) The mass in storage in the aquifer is equal to the difference in mass storage reported in the IN and OUT columns. This number can be compared to the number reported in the *.mas file. Also notice that in the OUT column the mass taken out of the pumping well and the mass flowing out of the lower boundary are individually listed. You can calculate mass flux in gm/yr for the last time step by calculating the change in mass between the last two time steps and dividing by the time step. The *mas file This file contains some of the same information as the *.out file, but notice that the mass coming out of the well and the mass coming out of the lower boundary are lumped into mass reported under “sinks”. The total mass in the aquifer is given and can be compared to the number you can compute from the difference in the IN and OUT columns for mass storage reported in the *.out file. The errors given in the *.mas file are computed from: This is the same error that is reported in the *.out file. An alternative mass error is given as: where Mt is the total mass (dissolved and sorbed) in the aquifer at time t, Mo is the initial mass (dissolved and sorbed) in the aquifer at the beginning of the simulation, SOURCE is the total mass into the aquifer from all external sources, and SINK is the total mass out of the aquifer from all external sinks. Mass Balance reported within Groundwater Vistas (GWV) You can also get a mass balance summary by using the Plot>mass balance>model summary option within GWV. These numbers are given as a mass flux (gm/yr) and are calculated by taking the concentration in the cell and multiplying by Q t. However, you have to be careful because not all of the reported numbers are correct. Also, note the large percent error owing to the fact that mass in storage is not reported. The amount being pumped out of the well is correct. (You can check this by calculating the flux out of the well from the *.out file.) The amount reported as injected into the well is incorrect because GWV takes the flow rate at the cell and multiplies it by the concentration in the cell at the last time step. You can compare this number with the correct mass flux into the injection cell by calculating the mass flux into the well from the *.out file, or by realizing that the mass flux into the well is constant and equal to the injection rate times the concentration in the source, 57.87 ppm. The amount report as flowing out the lower boundary is incorrect. This number includes mass that is erroneously calculated as leaving the system through the upper boundary. GWV assigns arbitrary reference concentration values of –1 to the cells that were designated as inactive concentration cells (i.e., those cells along the upper boundary). (Refer to the Basic package input window where the designation of concentration for no flow cells is given as –1.) Then when GWV calculates the mass flux at these cells, it takes the positive water flow rate times the negative concentration and gets a negative mass flux that is added to the negative mass flux that is leaving the model through the lower boundary. The correct mass flux leaving the lower boundary can be calculated from the *.out file. Or you can use the Plot>mass balance> window to draw a window over the cells along the lower boundary. This will give approximately the same mass flux through the lower boundary as computed from the *.out file. Finally, you can call up the Plot>mass balance>model summary window again and request to export the *.bal file. The cell-by-cell boundary fluxes for the upper and lower boundaries are itemized in the *.bal file. 2
