Where is my Peanut Activity
advertisement
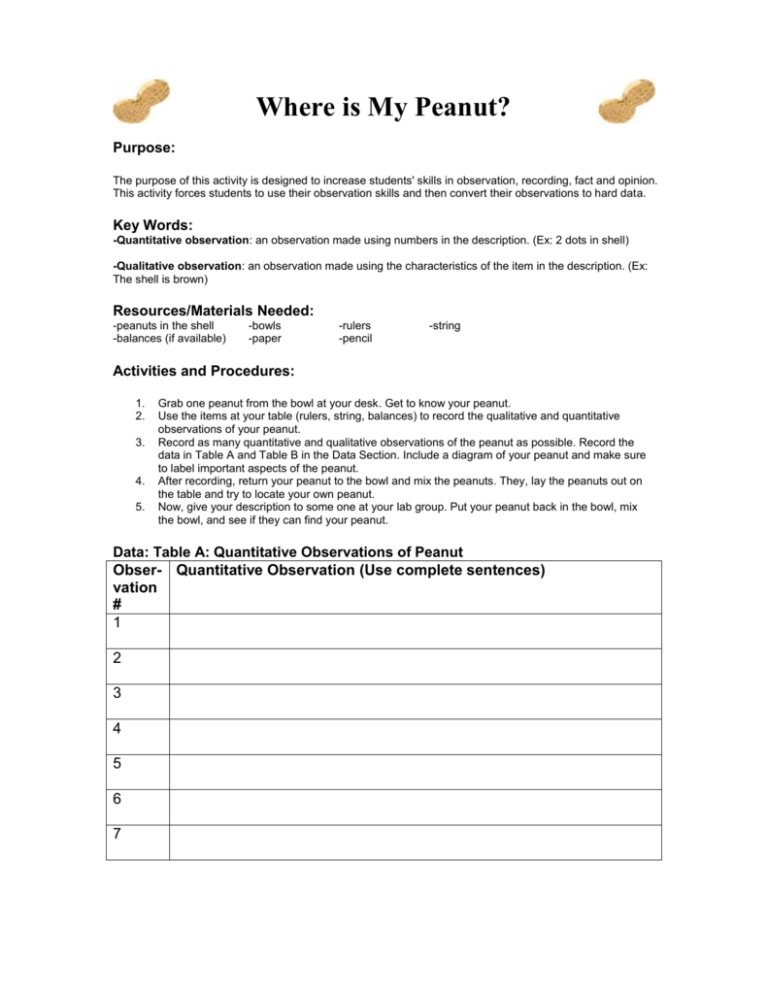
Where is My Peanut? Purpose: The purpose of this activity is designed to increase students' skills in observation, recording, fact and opinion. This activity forces students to use their observation skills and then convert their observations to hard data. Key Words: -Quantitative observation: an observation made using numbers in the description. (Ex: 2 dots in shell) -Qualitative observation: an observation made using the characteristics of the item in the description. (Ex: The shell is brown) Resources/Materials Needed: -peanuts in the shell -balances (if available) -bowls -paper -rulers -pencil -string Activities and Procedures: 1. 2. 3. 4. 5. Grab one peanut from the bowl at your desk. Get to know your peanut. Use the items at your table (rulers, string, balances) to record the qualitative and quantitative observations of your peanut. Record as many quantitative and qualitative observations of the peanut as possible. Record the data in Table A and Table B in the Data Section. Include a diagram of your peanut and make sure to label important aspects of the peanut. After recording, return your peanut to the bowl and mix the peanuts. They, lay the peanuts out on the table and try to locate your own peanut. Now, give your description to some one at your lab group. Put your peanut back in the bowl, mix the bowl, and see if they can find your peanut. Data: Table A: Quantitative Observations of Peanut Obser- Quantitative Observation (Use complete sentences) vation # 1 2 3 4 5 6 7 Table B: Qualitative Observations of Peanut Obser- Qualitative Observation (Use complete sentences) vation # 1 2 3 4 5 6 7 Diagram of Peanut (Use color too, write down the scale, and label observations) Analysis: Answer using complete sentences. Refrain from using the word “it.” 1) Differentiate between a quantitative and a qualitative observation. 2) Was it difficult to find your partner’s peanut? Why/why not? 3) You friend Bob yells out “My pet rock is completely black.” What type of observation is this? Explain. 4) Why, in science, is it important to give both types of observations in a data section of a lab report? Work collaboratively to determine the correct data type (quantitative or qualitative). Indicate whether quantitative data are continuous or discrete. 1. The number of pairs of shoes you own. 2. The type of car you drive. 3. Where you go on vacation. 4. The distance it is from your home to the nearest grocery store. 5. The number of classes you take per school year. 6. The tuition for your classes 7. The type of calculator you use. 8. Movie ratings. 9. Political party preferences. 10. Weight of sumo wrestlers. 11. Amount of money (in dollars) won playing poker. 12. Number of correct answers on a quiz. 13. Peoples' attitudes toward the government. 14. IQ scores. B8 Classroom Observations Part One Directions: Look around this classroom and make ten observations about the class. Write them below. 1. 2. 3. 4. 5. 6. 7. 8. 9. 10. Part Two Directions: Your teacher will talk about the differences between quantitative and qualitative observations. Now, go back through your classroom observations and identify whether you made quantitative or qualititative observations. Write the observation type next to your observation.
