Data on time needed to complete statistical forms
advertisement
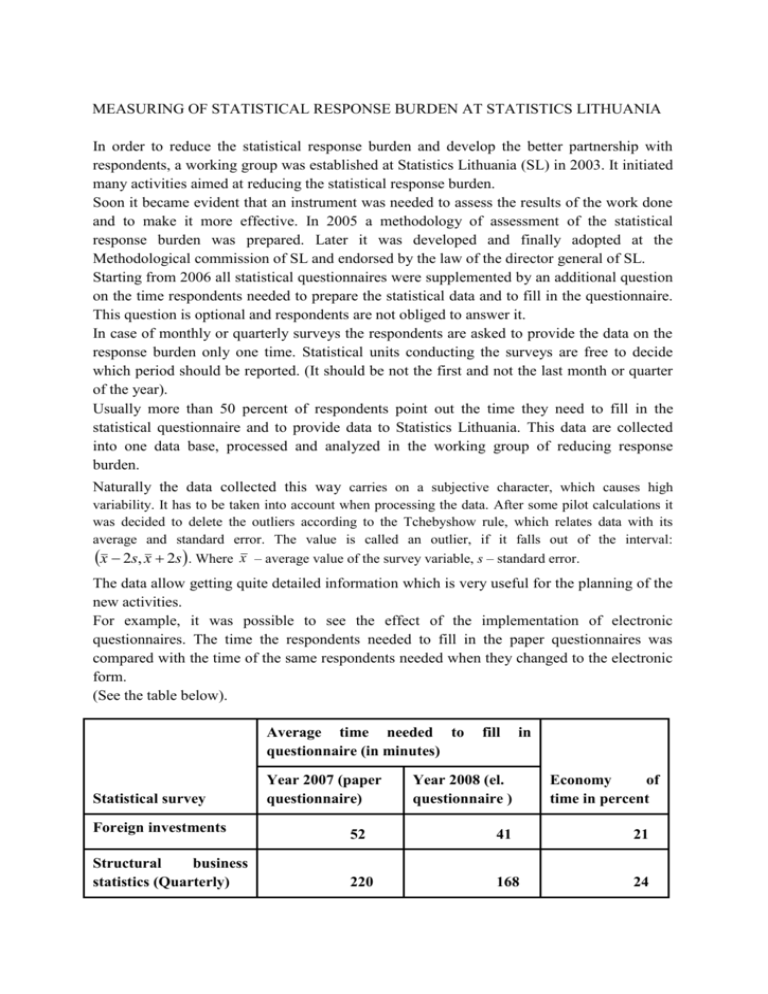
MEASURING OF STATISTICAL RESPONSE BURDEN AT STATISTICS LITHUANIA In order to reduce the statistical response burden and develop the better partnership with respondents, a working group was established at Statistics Lithuania (SL) in 2003. It initiated many activities aimed at reducing the statistical response burden. Soon it became evident that an instrument was needed to assess the results of the work done and to make it more effective. In 2005 a methodology of assessment of the statistical response burden was prepared. Later it was developed and finally adopted at the Methodological commission of SL and endorsed by the law of the director general of SL. Starting from 2006 all statistical questionnaires were supplemented by an additional question on the time respondents needed to prepare the statistical data and to fill in the questionnaire. This question is optional and respondents are not obliged to answer it. In case of monthly or quarterly surveys the respondents are asked to provide the data on the response burden only one time. Statistical units conducting the surveys are free to decide which period should be reported. (It should be not the first and not the last month or quarter of the year). Usually more than 50 percent of respondents point out the time they need to fill in the statistical questionnaire and to provide data to Statistics Lithuania. This data are collected into one data base, processed and analyzed in the working group of reducing response burden. Naturally the data collected this way carries on a subjective character, which causes high variability. It has to be taken into account when processing the data. After some pilot calculations it was decided to delete the outliers according to the Tchebyshow rule, which relates data with its average and standard error. The value is called an outlier, if it falls out of the interval: x 2s, x 2s . Where x – average value of the survey variable, s – standard error. The data allow getting quite detailed information which is very useful for the planning of the new activities. For example, it was possible to see the effect of the implementation of electronic questionnaires. The time the respondents needed to fill in the paper questionnaires was compared with the time of the same respondents needed when they changed to the electronic form. (See the table below). Average time needed to questionnaire (in minutes) Statistical survey Year 2007 (paper questionnaire) fill in Year 2008 (el. questionnaire ) Economy of time in percent Foreign investments 52 41 21 Structural business statistics (Quarterly) 220 168 24 Structural business statistics (Yearly) 560 356 36 Domestic trade survey 42 30 29 Job vacancy survey 51 32 37 Labor survey 192 105 45 As a result the decision was made to implement the electronic forms of all statistical questionnaires. This data allows also seeing effect of other measures aimed at the reducing of response burden. On the base of this data an indicator of statistical response burden is calculated every year. See also Swedish Presidency Report (SWPR) – Presentation of practical exercise on sharing good examples
