my example
advertisement
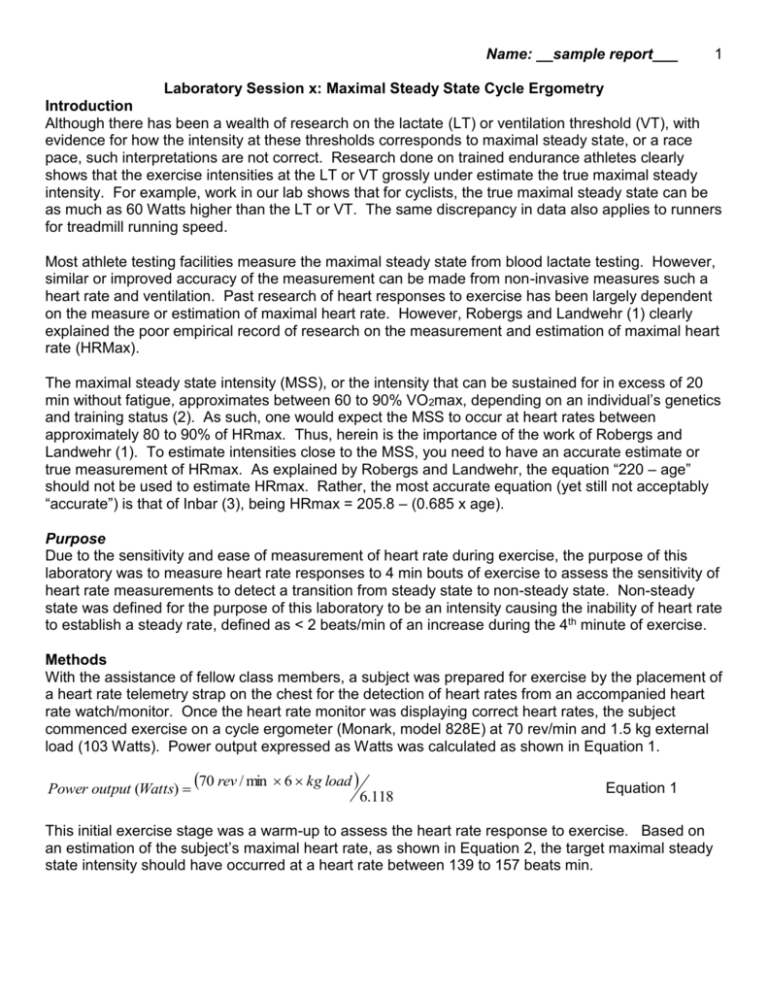
Name: __sample report___ 1 Laboratory Session x: Maximal Steady State Cycle Ergometry Introduction Although there has been a wealth of research on the lactate (LT) or ventilation threshold (VT), with evidence for how the intensity at these thresholds corresponds to maximal steady state, or a race pace, such interpretations are not correct. Research done on trained endurance athletes clearly shows that the exercise intensities at the LT or VT grossly under estimate the true maximal steady intensity. For example, work in our lab shows that for cyclists, the true maximal steady state can be as much as 60 Watts higher than the LT or VT. The same discrepancy in data also applies to runners for treadmill running speed. Most athlete testing facilities measure the maximal steady state from blood lactate testing. However, similar or improved accuracy of the measurement can be made from non-invasive measures such a heart rate and ventilation. Past research of heart responses to exercise has been largely dependent on the measure or estimation of maximal heart rate. However, Robergs and Landwehr (1) clearly explained the poor empirical record of research on the measurement and estimation of maximal heart rate (HRMax). The maximal steady state intensity (MSS), or the intensity that can be sustained for in excess of 20 min without fatigue, approximates between 60 to 90% VO 2max, depending on an individual’s genetics and training status (2). As such, one would expect the MSS to occur at heart rates between approximately 80 to 90% of HRmax. Thus, herein is the importance of the work of Robergs and Landwehr (1). To estimate intensities close to the MSS, you need to have an accurate estimate or true measurement of HRmax. As explained by Robergs and Landwehr, the equation “220 – age” should not be used to estimate HRmax. Rather, the most accurate equation (yet still not acceptably “accurate”) is that of Inbar (3), being HRmax = 205.8 – (0.685 x age). Purpose Due to the sensitivity and ease of measurement of heart rate during exercise, the purpose of this laboratory was to measure heart rate responses to 4 min bouts of exercise to assess the sensitivity of heart rate measurements to detect a transition from steady state to non-steady state. Non-steady state was defined for the purpose of this laboratory to be an intensity causing the inability of heart rate to establish a steady rate, defined as < 2 beats/min of an increase during the 4th minute of exercise. Methods With the assistance of fellow class members, a subject was prepared for exercise by the placement of a heart rate telemetry strap on the chest for the detection of heart rates from an accompanied heart rate watch/monitor. Once the heart rate monitor was displaying correct heart rates, the subject commenced exercise on a cycle ergometer (Monark, model 828E) at 70 rev/min and 1.5 kg external load (103 Watts). Power output expressed as Watts was calculated as shown in Equation 1. Power output (Watts) 70 rev / min 6 kg load 6.118 Equation 1 This initial exercise stage was a warm-up to assess the heart rate response to exercise. Based on an estimation of the subject’s maximal heart rate, as shown in Equation 2, the target maximal steady state intensity should have occurred at a heart rate between 139 to 157 beats min. Name: __sample report___ HR max 205.8 0.685 age 205.8 0.685 47 205.8 32.2 174 beats / min 2 Equation 2 Heart rates were recorded every 10 s by hand. Visual observation of the heart rates during the last min of stage 1 verified steady or non-steady state. A steady state heart rate response to this stage required the addition of 0.25 kg load resistance, amounting to an increase of 17 Watts at 70 rev/min. The subject then repeated a 4 min bout of exercise, with heart rates again recorded every 10 s. This procedure was repeated until the subject could no longer attain steady state heart rates during the 4th min of exercise. Maximal steady state (MSS) was mathematically defined as the average of the last steady state stage and the next non-steady state stage. The MSS was expressed as absolute heart rate and Watts, and relative to estimations of HRmax (% HRmax) and Watts at VO2max (% Watts at VO2max). Results Table 1 presents the cycle ergometry exercise conditions used for each stage of exercise. The subject transition from steady to non-steady state occurred when increasing power output from 137 to 154 Watts, with the MSS being 146 Watts at a heart rate of 152 beats/min. Stage Rest 1 2 3 4 Recovery Load (kg) 0 1.5 1.75 2.0 2.25 0 rpm 0 70 70 70 70 0 Watts 0 103 120 137 154 0 Figure 1presents all 10 s interval heart rate data during each bout, including 4 min of passive recovery. Figure 2 presents the continuously recorded heart rate data from the ECG electronic acquisition. As shown, heart rate increased to steady state in each of the 103, 120 and 137 Watts stages, but continued to increase during the last minute of stage 4 (154 Watts). Figure 1. Heart rate data as recorded every 10 s during rest, exercise and recovery. References 1. Robergs RA, Landwehr R. The surprising history of the “HRmax=220-age” equation. JEPonline 2002;5(2):1-10. 2. Robergs RA. Exercise Physiology: An electronic textbook and learning experience. NEXSIS.org, Albuquerque, 2008. 3. Inbar O. Oten A, Scheinowitz M, Rotstein A, Dlin R, Casaburi R. Normal cardiopulmonary responses during incremental exercise in 20-70-yr-old men. Med Sci Sport Exerc 1994;26(5):538546.
