FEL equations tech note
advertisement
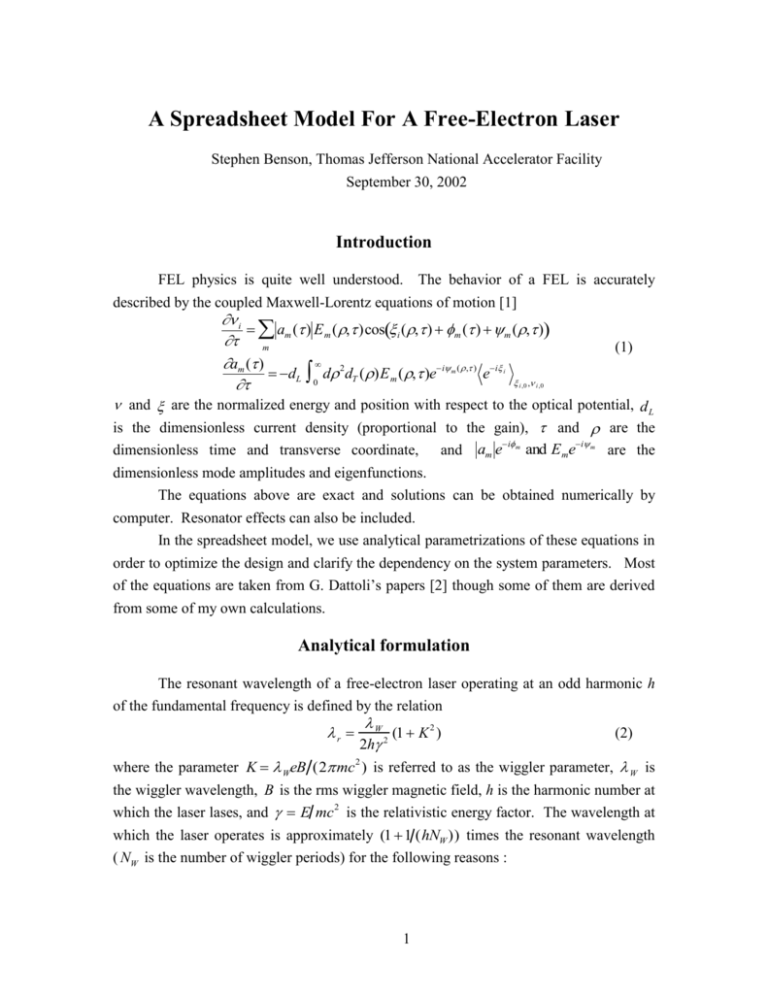
A Spreadsheet Model For A Free-Electron Laser Stephen Benson, Thomas Jefferson National Accelerator Facility September 30, 2002 Introduction FEL physics is quite well understood. The behavior of a FEL is accurately described by the coupled Maxwell-Lorentz equations of motion [1] i am ( ) E m ( , )cos i (, ) m ( ) m (, ) m am ( ) dL d 2dT ( )E m ( , )ei ( , ) ei 0 , m (1) i i ,0 i ,0 and are the normalized energy and position with respect to the optical potential, d L is the dimensionless current density (proportional to the gain), and are the i i dimensionless time and transverse coordinate, and am e m and E me m are the dimensionless mode amplitudes and eigenfunctions. The equations above are exact and solutions can be obtained numerically by computer. Resonator effects can also be included. In the spreadsheet model, we use analytical parametrizations of these equations in order to optimize the design and clarify the dependency on the system parameters. Most of the equations are taken from G. Dattoli’s papers [2] though some of them are derived from some of my own calculations. Analytical formulation The resonant wavelength of a free-electron laser operating at an odd harmonic h of the fundamental frequency is defined by the relation r W (1 K 2 ) 2 2h (2) where the parameter K WeB (2 mc 2 ) is referred to as the wiggler parameter, W is the wiggler wavelength, B is the rms wiggler magnetic field, h is the harmonic number at 2 which the laser lases, and E mc is the relativistic energy factor. The wavelength at which the laser operates is approximately (1 1 (hNW )) times the resonant wavelength ( NW is the number of wiggler periods) for the following reasons : 1 • • • • The gain maximum for a plane wave at small signal is shifted by about half of this amount. The position of the gain maximum moves away from resonance as the laser saturates. The presence of a Guoy phase shift in the optical mode increases the wavelength. Finally, the energy spread and emittance tends to shift the gain to longer wavelengths as well. We therefore define the operating wavelength by the equation: 1 1 hNW r (3) This formula is accurate if the Rayleigh range is close to one third of the wiggler length . For very large or small Rayleigh ranges the Guoy phase shift will be sufficiently different that the wavelength calculated from equation 3 will not be very accurate. The gain of a free-electron laser with a continuous beam in the low gain limit can be calculated from the expression I Nw 2 G 0.85 4 2.974 Bh I f (4) I0 where I is the peak current, I0 17045A is the Alven current, Bh is a Bessel function factor which characterizes the wiggler interaction at a given harmonic as a function of the wiggler strength, 2 hK 2 Bh 4h J h1 ( ) J h1 ( ) , where 2(1 K 2 ) 2 2 (5) The form of Bh for the first, third, and fifth harmonics versus K2 is shown in figure 1. The harmonic gain exceeds the fundamental gain for high K2 as long as the inhomogeneous gain reduction discussed below is near unity. Gain reduction factors The quantity I is the inhomogeneous gain reduction caused by the electron beam emittance and energy spread, f is the filling factor for the optical mode. Note that the gain reduction factors are defined such that they are unity for an ideal laser with zero emittance and energy spread and and an optimally matched resonator mode. This accounts for the factors of 0.85 and 2.974 which cancel reciprocal factors in I and f respectively. 2 Bessel Function factor B i 2.5 B 5 (K 2 ) 2 1.5 B 3 (K 2 ) 1 B 1 (K 2 ) 0.5 0 0 0.5 1 1.5 2 2.5 3 3.5 4 2 K Figure 1. Bessel function factor Bi for the first three allowed laser harmonics as a function of square of the wiggler parameter K . The gain degradation due to an energy spread and a normalized emittance N is given by: 1 2 (1 )sin e 2 I d 0.85 4 (1 a2x 2 )(1 a2y 2 ) 2 2 0 1 2 1 2 tan 1 (ax ) tan 1 (ay ) 4 hNW (6) 2 N L 2 N L , ax , ay x 0 R y 0R where is the energy detuning, x 0 and y0 are the electron beam envelope functions at the center of the wiggler, and L is the wiggler length. It is has been assumed that the electron beam is focussed to a waist in the center of the wiggler. We do not assume that the electron beam is matched in the focussing plane. If the focussing is weak, the gain is greater if the beam is focussed down to reduce the filling factor. The gain reduction factor is near unity when and ax ay . The maximum value of I vs. must be found for each set of values , ax , and ay . The optimum value for is given approximately by the equation a a y opt 2.606e 0.526 1.07 (2 5) x . (7) ax 3 a y 3 3 Note that it is fairly easy to use different emittances for the x and y directions but that this is not implemented in the spreadsheet. It would be fairly easy to do. The filling factor is defined as the average of the inverse effective mode size over the length of the interaction region: 1 4r dx f 2 2.974 1 7 Ae (x) 1 2 x 2 0 Ae (z) 4 N zR x x y x , = L 2z , x 2z R L (8) z 2 x (x) x 0 1 R 2 x 2 , y (x) W 2K x 0 The quantity zR is the Rayleigh range. For an electron beam with N 4 the filling factor falls to a value of about 0.5. No guiding effects are assumed in this model. The 2 factor 1 1 / 7in front of the integral is due to the effect of the Guoy phase shift on the gain. As noted above, the slope of the Guoy phase shift versus distance effects the resonant wavelength seen by the electrons. If the Rayleigh range is large, the slope is essentially constant but for small Rayleigh range the slope changes from the center of the wiggler to the ends. This reduces the gain somewhat. Equation (7) assumes that the electron beam is matched to the natural beta function of the wiggler. In fact, the spreadsheet can also take into account a mismatch as long as the number of betatron periods in the wiggler is less than one. It assumes that there is a waist at the center of the wiggler and propagates the beam out from that with the beam scalloping sinusoidally from there. Note however that the gain is always highest for a matched beta function when the wiggler focussing is large (i.e. the matched beta function is smaller than the wiggler length/). For a filamentary electron beam the filling factor is 2 f 1.345 r tan 1 1 (9) 7 This has a maximum value of 1 for zR = L/3 and N>>1. For N 4 the filling factor drops to ~0.5. For N 4 the filling factor decreases rapidly with increasing emittance. Slippage effects The gain of a free-electron laser is reduced when the transform-limited bandwidth of the electron bunch is comparable to or larger than the gain bandwidth. This effect is called slippage. 4 We can define two slippage factors, and to characterize this gain reduction: 1 1 hNW hNW , (10) 1 and 1 3 2 z z where z is the rms electron pulse length. The cavity length detuning curve (full width of the electronic gain) is given by (11) L 0.31GNW h The maximum small-signal gain occurs at a detuning 1/e times this. The calculated gain is the gain at the peak of the detuning curve. The laser gain for larger values of G0 is given by G G0 0.265 G02 (12) High gain can change the effect of the filling factor and inhomogeneous gain reduction. The spreadsheet does not accurately take this effect into account. In the spreadsheet, the high gain formula (12) is applied after the inhomogeneous gain reduction factor and the filling factor have been included. Gain reductions due to energy spread and emittance therefore have a larger effect than one might think. If the gain reduction factor I is greater than 0.5 this is still a good approximation. If the gain reduction factor is smaller than 0.5 one should run a full four dimensional code to check the results. Gain for a waveguide laser Using a waveguide mode for a free-electron laser at long wavelengths can strongly enhance the photon-electron interaction by keeping the optical mode wrapped around the electron beam. Let us assume a waveguide laser with a hybrid mode [3]. Also assume that the vacuum wavelength is much smaller than the waveguide height b so that the wavenumber in the waveguide is very close to the vacuum wavenumber. The small signal gain is now: G0 0.85 4 3.376 r L I Nw 2 B I0 h I f b (13) The definitions for all the variables are the same as for the Gaussian mode except for the filling factor: 5 1 4 dx f 2 3.376 1 14 Ae (x) 1 2 x 2 0 Ae (z) 8 N b L L 2z , x 2z R L x x y x , = (14) z 2 x (x) x 0 1 R 2 x 2 , y (x) W 2K x 0 For a zero emittance beam this becomes: 1.185 sinh 1 f 2 1 14 (15) This has a maximum value of 1 for =1.34 or zR=L/2.68. Note the factor of 14 instead of 7 in the denominator. This is due to the fact that the Guoy phase shift is half as much in the waveguide FEL as in a Gaussian mode FEL. The gain for a short electron bunch is the same as for the Gaussian mode FEL as a function of the electron bunch length so equation 12 can be used. Saturated Power output Dattoli has approximated the laser output power for a given optical cavity loss and extraneous loss in the case of low gain: 1.8 ( )IS LRA G(1 ) Pout 1 exp 2.97 f I 1 G / I G 1 1 1 I 2 mc 3 1 K 2 mc 3 IA IS , 8.71 GW 16 re h 2 Bh N W 4 r2 re c (16) Aopt , Aopt Aeb RA Aeb 1, Aopt Aeb where the gain in the absence of inhomogeneous gain reduction and including high gain effects has been used in Dattoli’s formula [4] instead of the actual small signal gain and the effective area used to compute the power is given by LRA /(2.97 f ) . The reason the inhomogeneous gain reduction has been factored out is that the energy acceptance increases greatly at saturation as shown by numerous simulations. This can lead to the rather odd result that the laser can put out power even if the gain is less than the losses. It should be noted that the power is probably not to be trusted when the small signal gain is less than twice the cavity losses. 6 Dattoli’s formula is only good for small gain systems. If the small signal gain is greater than about 30%, the formula above will underestimate the power. Simulations must be used to double check the results for these cases. The scaling of the power with the input parameters will be fairly accurate however. For a waveguide laser the formula is the same except that the effective area used to calculate the power is given by 0.296 b RA L f . Implementation of the formulas in the spreadsheet A Microsoft Excel spreadsheet was written which incorporates the equations in this document. The Gaussian mode spreadsheet is on the first sheet and the waveguide mode is on the second sheet. The second sheet uses the input parameters from the first sheet. Calculated values are differentiated from the inputs by color-coding. Calculated results are in white on a blue background while inputs are in black on a cyan background. This is the convention used in EPICS. Note: Do not try to input a value into a cell with white on blue text since this will usually delete the formula in that cell. To set up Excel to work with the spreadsheet one must pull up the Add-in dialogue box in the Tools menu and enable the “Analysis TooPak” and the :Analysis TooPak – VBA” Add-ins. These are included on the installation disk in the extras folder. If they are not in the list of Add-ins you need to install them from the installation disk. One must also enable comments in the “Views” tabbed panel of the preferences dialogue box. Input of parameter: The parameters of the electron beam such as the transverse and longitudinal emittances, the charge per bunch, the micropulse length, the micropulse frequency, and the electron energy are entered in cells B2-B8. Sometimes the normalized emittances can be scaled from a given value as a function of charge and the values in B2-B5 scaled from a given value in cells C2-C5. The wiggler parameters are input in cells B13–B15. The optical cavity parameters are input in cells B20–B23. The gain and power output is calculated for a series of wavelengths that are input in cells E3– E10. These cells are mapped onto cells B29–I29. Many cells have attached comments. These should popup on rollover. If not, turn on comments in the view tab of the preferences window. Tuning: One can tune an FEL at a given harmonic and for a given wiggler wavelength using the wiggler parameter or the electron beam energy. The spreadsheet uses the maximum electron beam energy possible while varying the wiggler parameter to 7 get the correct wavelength. If one has a fixed wiggler strength, raise the maximum energy high enough to keep the value of K2 (in cells B34-H34) equal to the maximum value in cell B15. If one wants to vary the wiggler at a constant energy, adjust the wavelength range or electron beam energy so that the wiggler strength varies from the maximum value possible (cell B15) to the smallest value at which the gain is reasonable (usually around K2=0.5) The resonant wavelength is calculated from the operating wavelength using equation (2). To find the wiggler strength and the electron beam energy, the maximum energy that can produce that resonant wavelength is used to calculate gammamax. The lesser of this value and the maximum energy available from the accelerator (cell B7) is used for the accelerator energy. For gammamax higher than the maximum available energy the wiggler parameter is reduced so that the proper wavelength is achieved. The energy spread is calculated from the bunch length and the longitudinal emittance. It is assumed that the longitudinal emittance and the bunch length are independent of the electron beam energy so the energy spread varies inversely with the energy. The gain reduction due to slippage, energy spread, emittance, and filling factor are multiplied to get the Gain red. Factor which gives you some idea of how much the laser is hurt by a non-ideal beam. The laser gain is shown in row 58 which is mirrored in cells F3-F10. The gain is also plotted in a chart below the table. The cavity losses may be input separately for each wavelength if the cavity losses versus wavelength are known. The non-output-coupling losses (mirror absorption, scatter, diffraction) are input in row 60. The output coupling efficiency and the ratio of the small-signal gain to the losses are shown in the next two rows. It is important to keep the gain-to-loss ratio in the range of 3 to 5 so that the laser will be stable. If the ratio is less than 2 the power calculated below is not to be trusted. The volume ratio in equation 16 is then calculated. This is used to calculate the output power. If this is less than unity, the power output is reduced linearly with the ratio. This is due to the fact that not all the electrons are in the optical mode and therefore do not contribute. If the factor is greater than unity, the power is multiplied by one. Equation 16 is used to calculate the peak power. It is up to the user of the spreadsheet to check that the small signal gain is at least twice the cavity losses. As noted previously, if it is smaller the power output may be an overestimate. The average power is calculated by multiplying the peak power by the duty cycle. The laser micropulse length is assumed to be equal to the square root of electron micropulse length multiplied by the slippage length. This model, suggested by Dattoli, seems to agree well with 8 simulations. The average power is compared to the 1/4NW and extraction as a fraction of this efficiency is calculated. Typical values are from 0.5 to 1. The micropulse energy is calculated by dividing the average power by the frequency and the radius of the mode on the mirror is calculated and used to determine the mirror loading. The mirror radius calculated in row 70 is twice the Gaussian 1/e2 waist. The physical mirror radius should be at least 0.75 times this size and preferably greater than the indicated radius. . In the waveguide worksheet the area is calculated using an area given by 2 b zR L 1 (17) A 2 2 2zR If the mirror loading exceeds 100 kW/cm2, there may be damage to the mirror surface if the laser is CW. If the laser is pulsed, the fluence should be calculated and normalized to the damage fluence for a one-microsecond pulse. This is normally around 50 J/cm2 for a good metal coating. The damage threshold varies as the square root of the pulse length so e.g. a 100 µsec pulse should have a damage threshold of 500 J/cm2. For pulses as long as one second, the CW damage threshold of 100 kW/cm2 determines the limit The last three rows of the spreadsheet are for beam matching. They are the Twiss parameters at the wiggler entrance and the betatron phase advance in the wiggler. Conclusion The gain values from this spreadsheet are reasonably accurate and agree well with simulations for a wide range of paramter space. If the gain is much higher than 100%, the results should be viewed with a great deal of suspicion since guiding effects will probably become important. The power estimates are fine for large gain to loss ratios and small gain. For large gain the power will be underestimated. In the future I will try to extend the model to include high gain effects and short pulse effects. References 1. W. B. Colson, “The Nonlinear Wave Equation for Higher Harmonic in FreeElectron Lasers”, IEEE J. of Quant. Elec. QE-17, No. 8, August 1981, 1417. 2. G. Dattoli et al., “Parametrizing the Gain Dependencies in a Single Passage FEL Operation with Moderate Current e-Beams”, Nucl. Inst. and Meth. A285 9 (1989)108-114; “Intensity Saturation Mechanism in Free-electron Lasers”, G. Dattoli, L. Giannessi, and S. Cabrini, IEEE J. Quant. Elect., QE-28, (1992) 770– 772; “Free-Electron Laser Saturated Regime, Cavity Modulation, and Harmonic Generation”, G. Dattoli, L. Mezi, A. Renieri, and A. Torre, IEEE J. Quant. Elect., QE-34, (1998) 1782. 3. 3. A. Amir et al. “Cylindrical Gaussian eigenmodes of a rectangular waveguide resonator three-dimensional numerical calculation of Gain per mode” SPIE Volume 453, in Free-Electron Generators of Coherent Radiation, C. A. Brau, S. F. Jacobs, M. O. Scully Eds., p. 235. 10


