Supplementary material: Detailed statistical analysis methods
advertisement
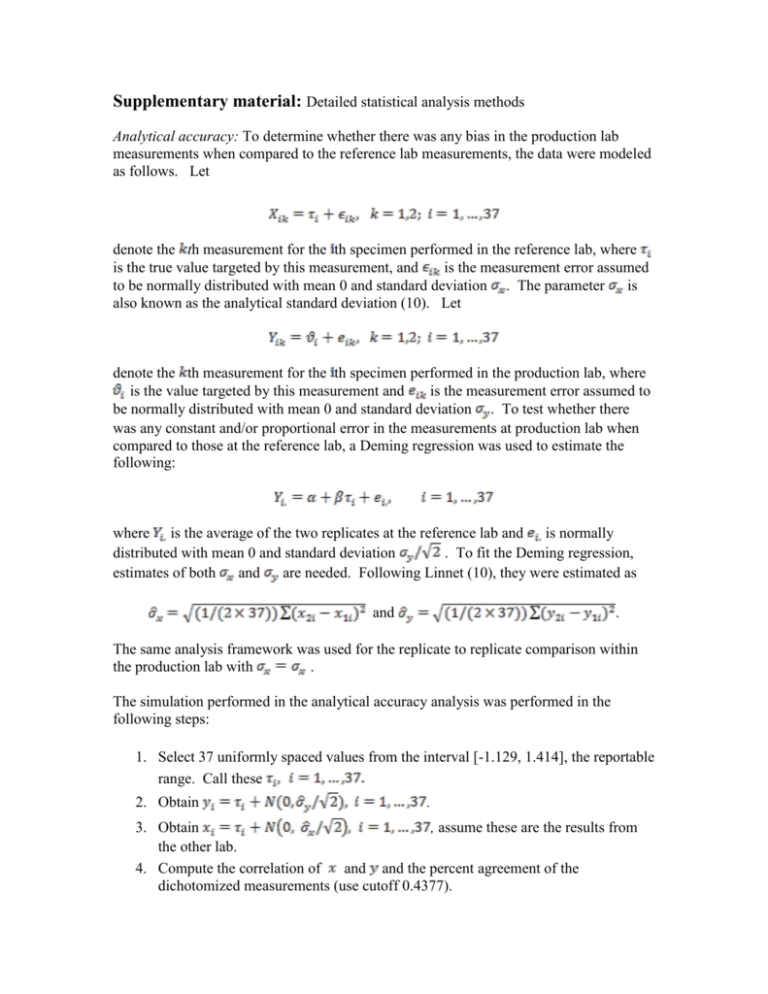
Supplementary material: Detailed statistical analysis methods Analytical accuracy: To determine whether there was any bias in the production lab measurements when compared to the reference lab measurements, the data were modeled as follows. Let denote the th measurement for the th specimen performed in the reference lab, where is the true value targeted by this measurement, and is the measurement error assumed to be normally distributed with mean 0 and standard deviation . The parameter is also known as the analytical standard deviation (10). Let denote the th measurement for the th specimen performed in the production lab, where is the value targeted by this measurement and is the measurement error assumed to be normally distributed with mean 0 and standard deviation . To test whether there was any constant and/or proportional error in the measurements at production lab when compared to those at the reference lab, a Deming regression was used to estimate the following: where is the average of the two replicates at the reference lab and is normally distributed with mean 0 and standard deviation . To fit the Deming regression, estimates of both and are needed. Following Linnet (10), they were estimated as and . The same analysis framework was used for the replicate to replicate comparison within the production lab with . The simulation performed in the analytical accuracy analysis was performed in the following steps: 1. Select 37 uniformly spaced values from the interval [-1.129, 1.414], the reportable range. Call these 2. Obtain . 3. Obtain , assume these are the results from the other lab. 4. Compute the correlation of and and the percent agreement of the dichotomized measurements (use cutoff 0.4377). 5. Repeat 1000 times, store the average of the estimates in step 4. 6. Repeat the simulation with different ranges (at 0.8, 0.5 and 0.25 of the center of [1.129, 1.414]). Precision: The following four-way nested ANOVA model was used in the first substudy. where is the th observations on the th specimen in the th risk level, by the th operator, on the th day. The grand mean is denoted by . The term is the fixed effect due to the th risk level, is the effect due to the th specimen nested within the th risk level, is the effect due to the th operator within the th specimen in the th risk level, is the effect due to the th day nested within the th specimen in the th risk level and the th operator. The term represents the measurement error. All terms , , , and (for all ) are assumed independently and normally distributed with mean zero and variances , , and , respectively. The estimates of these variance components are denoted by , , and and the estimates of the standard deviations are denoted by , , and The repeatability of the assay was estimated by The following two-way ANOVA model was fitted to the signature scores resulting from the lot to lot testing experiment: where is the th replicate using the th lot of the WT Ovation kit and the th lot of the Encore kit. The grand mean is denoted by . The term is the effect due to the th lot of the WT Ovation kit, is the effect due to the th lot of the Encore kit. The term represents the measurement error. All terms , and (for all ) are assumed independently and normally distributed with mean zero and variances , and , respectively. The estimates of these variance components are denoted by , and . The reproducibility was estimated by: where and Encore kits. are the estimates of lot to lot variability due to the WT Ovation and The variability due to operators in the production lab, based on the accuracy study, in which each technical replicate on each specimen was randomized to a distinct operator, was estimated by the following ANOVA model: where is the th observations on the th specimen in the th risk level, by the th operator. The grand mean is denoted by . The term is the fixed effect due to the th risk level, is the effect due to the th specimen within the th risk level, and is the effect due to the th operator nested within the th risk level and the th specimen. Since the operators are confounded with the technical replicates, can also be regarded as the model measurement error. The interest is in estimating the standard deviation associated with , and compare it to from the precision study above. Analytical sensitivity: The following one-way ANOVA model was used to evaluate the difference in the mean signature scores among the 5 concentration levels in the RNA concentration sensitivity study: where is the fixed effect due to the th concentration level. A mixed model was used to test whether the percentage mix of tumor and non-tumor tissue (within the studied percentage range) had an effect on the signature score in the tumor percentage study: . where is the general mean, the term is the fixed effect due to the th risk level, is the effect of the th subject nested within the th risk level, is the effect due to the th concentration level, is the interaction effect between the th risk and th concentration levels and is the interaction between the th concentration level and the th subject nested within the th risk level.
