Module 1: Practice Problems - PP1 A1. The AMI Company has two
advertisement
Module 1: Practice Problems - PP1
_______________________
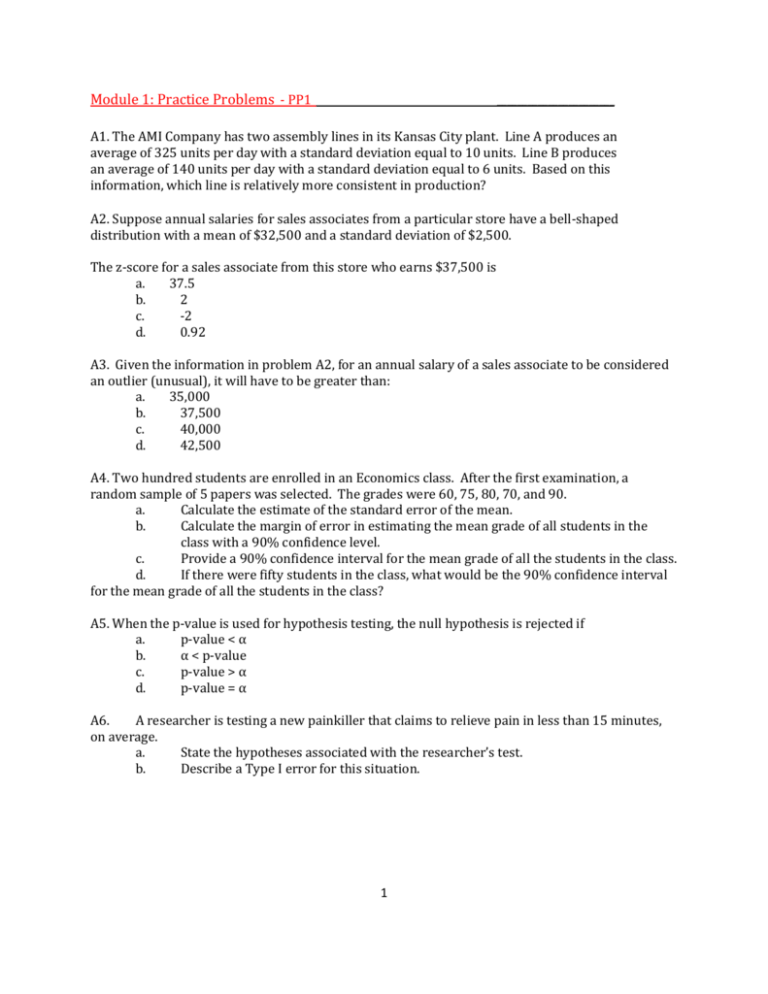
A1. The AMI Company has two assembly lines in its Kansas City plant. Line A produces an
average of 325 units per day with a standard deviation equal to 10 units. Line B produces
an average of 140 units per day with a standard deviation equal to 6 units. Based on this
information, which line is relatively more consistent in production?
A2. Suppose annual salaries for sales associates from a particular store have a bell-shaped
distribution with a mean of $32,500 and a standard deviation of $2,500.
The z-score for a sales associate from this store who earns $37,500 is
a.
37.5
b.
2
c.
-2
d.
0.92
A3. Given the information in problem A2, for an annual salary of a sales associate to be considered
an outlier (unusual), it will have to be greater than:
a.
35,000
b.
37,500
c.
40,000
d.
42,500
A4. Two hundred students are enrolled in an Economics class. After the first examination, a
random sample of 5 papers was selected. The grades were 60, 75, 80, 70, and 90.
a.
Calculate the estimate of the standard error of the mean.
b.
Calculate the margin of error in estimating the mean grade of all students in the
class with a 90% confidence level.
c.
Provide a 90% confidence interval for the mean grade of all the students in the class.
d.
If there were fifty students in the class, what would be the 90% confidence interval
for the mean grade of all the students in the class?
A5. When the p-value is used for hypothesis testing, the null hypothesis is rejected if
a.
p-value < α
b.
α < p-value
c.
p-value > α
d.
p-value = α
A6.
A researcher is testing a new painkiller that claims to relieve pain in less than 15 minutes,
on average.
a.
State the hypotheses associated with the researcher’s test.
b.
Describe a Type I error for this situation.
1
A7. There are 8,000 students at the University of Tennessee at Chattanooga. The average age of all
the students is 24 years with a standard deviation of 9 years. A random sample of 36 students is
selected.
a.Determine the standard error of the mean.
b.What is the probability that the sample mean will be larger than 19.5?
c.What is the probability that the sample mean will be between 25.5 and 27 years?
A8. A simple random sample of 5 observations from a population containing 400 elements was
taken, and the following values were obtained.
12
18
19
20
21
A point estimate of the population mean is
a.
400
b.
18
c.
20
d.
10
A9. A simple random sample of 64 observations was taken from a large population. The population
standard deviation is 120. The sample mean was determined to be 320. The standard error of the
mean is
a.
1.875
b.
40
c.
5
d.
15
A10. The set of all elements of interest in a study is
a.
set notation
b.
a set of interest
c.
a sample
d.
a population
2
A11. A subset of a population selected to represent the population is a
a.
subset
b.
sample
c.
small population
d.
None of the alternative answers is correct.
A12. A simple random sample of size n from a finite population of size N is a sample selected such
that each possible sample of size
a.
N has the same probability of being selected
b.
n has a probability of 0.5 of being selected
c.
n has a probability of 0.1 of being selected
d.
n has the same probability of being selected
A13. The manager of a grocery store has taken a random sample of 100 customers. The average
length of time it took the customers in the sample to check out was 3.1 minutes with a standard
deviation of 0.5 minutes. We want to test to determine whether or not the mean waiting time of all
customers is significantly more than 3 minutes.
a)The t-test statistic is
a.
1.96
b.
1.64
c.
2.00
d.
0.056
b) The p-value is
a.
0.025
b.
0.0456
c.
0.05
d.
0.0228
c) At a .05 level of significance, it can be concluded that the mean of the population is
a.
b.
c.
d.
significantly greater than 3
not significantly greater than 3
significantly less than 3
significantly greater then 3.18
3
Answers to Practical Problems – Module 1
A1. The AMI Company has two assembly lines in its Kansas City plant. Line A produces an
average of 325 units per day with a standard deviation equal to 10 units. Line B produces an
average of 140 units per day with a standard deviation equal to 6 units. Based on this
information, which line is relatively more consistent in production?
Use the coefficient of variation concept to compare groups (see module 1.3):
CV (A) = 10/325*100 = 3.08%
CV (B) = 6/140*100 = 4.29%
Line A is more consistent (only slightly more)
A2. Suppose annual salaries for sales associates from a particular store have a bell-shaped
distribution with a mean of $32,500 and a standard deviation of $2,500.
The z-score for a sales associate from this store who earns $37,500 is
a.
37.5
b.
2
c.
-2
d.
0.92
Z= (37,500-32,500)/(2500) = 2….answer is b
A3.
Outlier > mean + 3* (st. deviation)
Outlier > 32,500 + 3*(2,500) > 40,000
Answer is c.
4
A4. Two hundred students are enrolled in an Economics class. After the first examination, a
random sample of 5 papers was selected. The grades were 60, 75, 80, 70, and 90.
c.
d.
Calculate the estimate of the standard error of the mean.
Calculate the margin of error in estimating the mean grade of all students in the class
with a 90% confidence level.
c.
Provide a 90% confidence interval for the mean grade of all the students in the class.
d.
If there were 50 students in the class, what would be the 90% confidence interval for the
mean grade of all the students in the class?
Mean = 75, s = 11.18, n=5
a.SE=(s/sqrt(n)) = 5
b. t = 2.78 (use =TINV(alpha, n-1)) …….margin of error = 2.13* 5 = 10.65
c. 75 ± 10.65 or…I am 90% confident that the true mean score is between 64.35 and 85.65
d. Not covered in class but the theory found in equation 1.4.14:
When the sample is large with respect to the population size ( n / N > 5 %):
Eq. 1.4.14: 95% Confidence Interval for True Population Mean:
= Sample Mean ± t (n - 1) *{[S / Sq. Rt. (n)]*[Sq. Rt.((N - n)/(N-1))]}
where n = the sample size and N = the population size (the rule of thumb is n / N should be less
than or equal to 5 % before we apply the correction factor).
In our example: n = 5 and N= 50 and n/N = 10%. Therefore we should employ a correction
factor to the confidence interval as in the above equation.
= 75 ± 2.13 * {[11.18/2.23] * [Sqrt((50-5/(50-1))]=
= 75 ± 2.13 * {[11.18/2.23] * 0.958}
= 75 ± 2.13 * 4.8 = 75 ± 10.23 = ( the 90% confidence interval is then between 64.77 and 85.23)
Compare with the results in c where you assumed the population size is infinite compared with
the sample size.
5
A5. When the p-value is used for hypothesis testing, the null hypothesis is rejected if
a.
p-value < α…….correct
b.
α < p-value
c.
p-value > α
d.
p-value = α
A6.
A researcher is testing a new painkiller that claims to relieve pain in less than 15
minutes, on average.
a.
State the hypotheses associated with the researcher’s test.
b.
Describe a Type I error for this situation.
a. H0: population mean time = 15 min
Ha: population mean time < 15 min
b. the researcher concludes that the painkiller is effective in less than 15 minutes but in
reality it is not.
A7. There are 8,000 students at the University of Tennessee at Chattanooga. The average age
of all the students is 24 years with a standard deviation of 9 years. A random sample of 36
students is selected.
a.Determine the standard error of the mean.
b.What is the probability that the sample mean will be larger than 19.5?
c.What is the probability that the sample mean will be between 25.5 and 27 years?
ANSWERS:
a.
1.5
b.
0.9986
c.
0.1359
a. std dev/sqroot(sample size) = 9/sqroot(36) = 1.5
b. z=(19.5-24)/(standard error of the mean)= 19.5-24)/1.5= -4.5/1.5 = -3
using excel function =1-normsdist(-3) we get 0.9986
c. z for 25.5 is (25.5-24)/1.5=1
6
z for 27 is (27-24)/1.5=2
using excel functions =normsdist(2) – normsdist(1) = 0.1359
A8. A simple random sample of 5 observations from a population containing 400 elements was taken,
and the following values were obtained.
12
18
19
20
21
A point estimate of the population mean is
a.
b.
c.
d.
ANSWER:
400
18
20
10
b
A9. A simple random sample of 64 observations was taken from a large population. The population
standard deviation is 120. The sample mean was determined to be 320. The standard error of the mean is
a.
1.875
b.
40
c.
5
d.
15
ANSWER:
d
A10. The set of all elements of interest in a study is
a.
set notation
b.
a set of interest
c.
a sample
d.
a population ANSWER:d
A11. A subset of a population selected to represent the population is a
a.
subset
b.
sample
c.
small population
d.
None of the alternative answers is correct. ANSWER:
b
A12. A simple random sample of size n from a finite population of size N is a sample selected such that
each possible sample of size
a.
N has the same probability of being selected
b.
n has a probability of 0.5 of being selected
c.
n has a probability of 0.1 of being selected
d.
n has the same probability of being selected…ANSWER: d
7
A13. The manager of a grocery store has taken a random sample of 100 customers. The average length
of time it took the customers in the sample to check out was 3.1 minutes with a standard deviation of 0.5
minutes. We want to test to determine whether or not the mean waiting time of all customers is
significantly more than 3 minutes.
a)The t-test statistic is
a.
1.96
b.
1.64
c.
2.00
d.
0.056 ANSWER:
c
b)The p-value is
a.
0.024
b.
0.0456
c.
0.05
d.
0.0228 ANSWER:
a
c) At a .05 level of significance, it can be concluded that the mean of the population is
a.
significantly greater than 3
b.
not significantly greater than 3
c.
significantly less than 3
d.
significantly greater then 3.18 ANSWER:
a
8
