Homework 10
advertisement
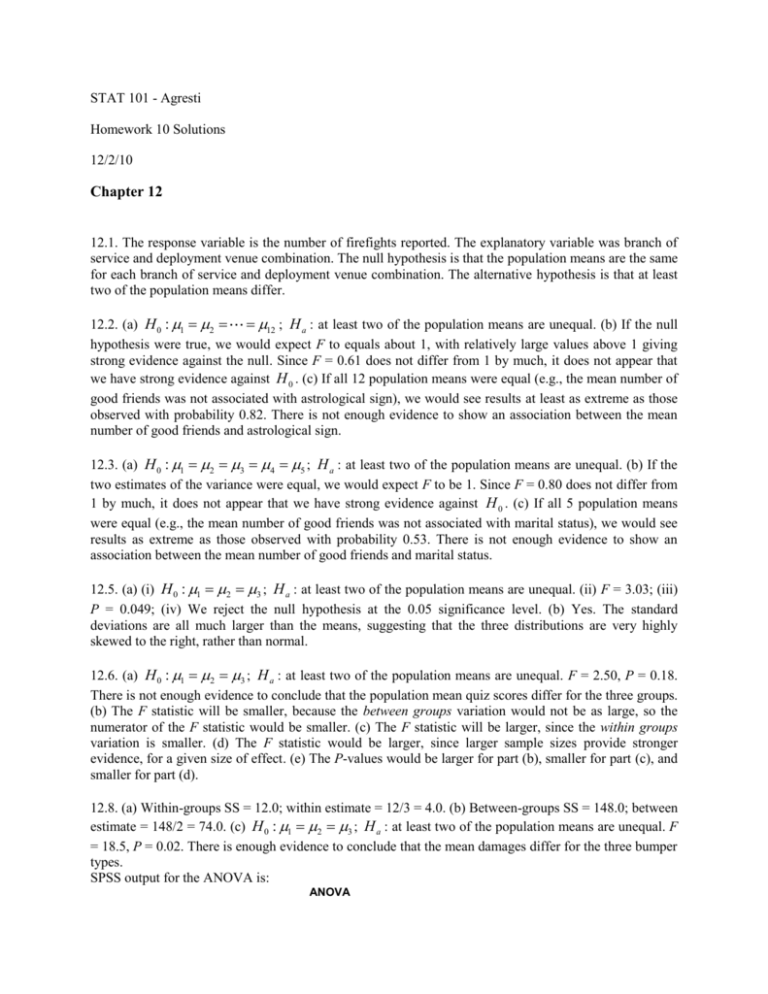
STAT 101 - Agresti Homework 10 Solutions 12/2/10 Chapter 12 12.1. The response variable is the number of firefights reported. The explanatory variable was branch of service and deployment venue combination. The null hypothesis is that the population means are the same for each branch of service and deployment venue combination. The alternative hypothesis is that at least two of the population means differ. 12.2. (a) H 0 : 1 2 12 ; H a : at least two of the population means are unequal. (b) If the null hypothesis were true, we would expect F to equals about 1, with relatively large values above 1 giving strong evidence against the null. Since F = 0.61 does not differ from 1 by much, it does not appear that we have strong evidence against H 0 . (c) If all 12 population means were equal (e.g., the mean number of good friends was not associated with astrological sign), we would see results at least as extreme as those observed with probability 0.82. There is not enough evidence to show an association between the mean number of good friends and astrological sign. 12.3. (a) H 0 : 1 2 3 4 5 ; H a : at least two of the population means are unequal. (b) If the two estimates of the variance were equal, we would expect F to be 1. Since F = 0.80 does not differ from 1 by much, it does not appear that we have strong evidence against H 0 . (c) If all 5 population means were equal (e.g., the mean number of good friends was not associated with marital status), we would see results as extreme as those observed with probability 0.53. There is not enough evidence to show an association between the mean number of good friends and marital status. 12.5. (a) (i) H 0 : 1 2 3 ; H a : at least two of the population means are unequal. (ii) F = 3.03; (iii) P = 0.049; (iv) We reject the null hypothesis at the 0.05 significance level. (b) Yes. The standard deviations are all much larger than the means, suggesting that the three distributions are very highly skewed to the right, rather than normal. 12.6. (a) H 0 : 1 2 3 ; H a : at least two of the population means are unequal. F = 2.50, P = 0.18. There is not enough evidence to conclude that the population mean quiz scores differ for the three groups. (b) The F statistic will be smaller, because the between groups variation would not be as large, so the numerator of the F statistic would be smaller. (c) The F statistic will be larger, since the within groups variation is smaller. (d) The F statistic would be larger, since larger sample sizes provide stronger evidence, for a given size of effect. (e) The P-values would be larger for part (b), smaller for part (c), and smaller for part (d). 12.8. (a) Within-groups SS = 12.0; within estimate = 12/3 = 4.0. (b) Between-groups SS = 148.0; between estimate = 148/2 = 74.0. (c) H 0 : 1 2 3 ; H a : at least two of the population means are unequal. F = 18.5, P = 0.02. There is enough evidence to conclude that the mean damages differ for the three bumper types. SPSS output for the ANOVA is: ANOVA Damage Sum of Squares Between Groups Within Groups Total df Mean Square 148.000 2 74.000 12.000 3 4.000 160.000 5 F Sig. 18.500 0.021 12.10. (a) F = 13.00/0.47 = 27.6; df1 = 2; df2 = 297; P = 0.000. There is sufficient evidence to conclude that the population mean customer satisfaction ratings differ among the cities. (b) Since all of the sample sizes are the same, the margin of error for separate 95% confidence intervals will be the same for 1 1 0.19 . We are 95% 100 100 comparing the population means for each pair of cities. 1.972 0.47 confident that the interval –0.39 to –0.01 contains the true difference in population mean customer satisfaction ratings between San Jose and Toronto. We are 95% confident that the interval 0.31 to 0.69 contains the true difference in population mean customer satisfaction ratings between San Jose and Bangalore. We are 95% confident that the interval 0.51 to 0.89 contains the true difference in mean population customer satisfaction ratings between Toronto and Bangalore. (c) The Bonferroni method uses error probability 0.05/3 = 0.0167 for each interval, leading to a larger margin of error than for the individual confidence intervals. The Tukey method is similar in theory. The advantage of this approach is that the overall error probability is 0.05 instead of 0.05 for each interval. (d) For San Jose, z1 = 1 and z2 = 0, so ŷ = 7.6. For Toronto, z1 = 0 and z2 = 1, so ŷ = 7.8. For Bangalore, z1 = 0 and z2 = 0, so ŷ = 7.1. Note that in the prediction equation, 7.1 is the sample mean for Bangalore, 0.5 is the difference between the sample means for San Jose and Bangalore, and 0.7 is the difference between the sample means for Toronto and Bangalore. 12.12. (a) Does the population mean number of good friends differ for those who consider themselves very happy, pretty happy, and not too happy? (b) F = 3.47, P = 0.032; At the 0.05 significance level there appears to be a difference in the population mean number of good friends for the happiness categories. (c) Since 0 is contained in the Tukey intervals for the comparison of very happy and not too happy, these two groups are not significantly different. Similarly, the pretty happy and not too happy groups are not significantly different. Since the Tukey interval comparing very happy and pretty happy is entirely above zero, these two groups are significantly different, and that the mean number of good friends is higher for those who are very happy than those who are pretty happy. 12.14. H 0 : 1 2 3 ; H a : at least two of the population means are unequal. Between-groups mean square = 36.0; within-groups mean square = 45.333, F = 0.79, P = 0.48. There is not enough evidence to conclude that the population mean amount of time of REM sleep differs for the three groups. The 1 1 13.95 , which is the margin of error for each 4 4 minimum significant difference is 2.93 45.333 pairwise 95% confidence interval using the Bonferroni method. The means are all grouped together, in the sense that no pair of them show evidence of being different. 12.15. (a) E y 1 z1 2 z2 , with z1 = 1 for group 1 and 0 otherwise, z2 = 1 for group 2 and 0 otherwise. H 0 : 1 2 3 is equivalent to H 0 : 1 2 0 . (b) For group 1, ŷ = 18 – 6(1) – 3(0) = 12.0. For group 2, ŷ = 18 – 6(0) – 3(1) = 15.0. For group 3, ŷ = 18 – 6(0) – 3(0) = 18.0. These are the means listed at the bottom of the SAS printout. Note that in the prediction equation, 18 is the sample mean for group 3, -6 is the difference between the sample means for group 1 and group 3, and -3 is the difference between the sample means for group2 and group 3. 12.16. (a) E y 1 z1 2 z2 , with z1 = 1 for Bumper A and 0 otherwise, z2 = 1 for Bumper B and 0 otherwise. (b) H 0 : 1 2 3 is equivalent to H 0 : 1 2 0 . (c) The prediction equation is yˆ 13 11z1 10 z2 . 12.17. Sex does not appear to be a significant factor in the comparison of mean number of hours a day watching TV (P = 0.55, and the means for each sex are comparable within race). Race does appear to be a significant factor in the comparison of mean number of hours a day watching TV (P = 0.000, and the means for each race are quite different, with blacks having a higher mean than whites). 12.17. Sex does not appear to be a significant factor in the comparison of mean number of hours a day watching TV (P = 0.55, and the means for each sex are comparable within race). Race does appear to be a significant factor in the comparison of mean number of hours a day watching TV (P = 0.000, and the means for each race are quite different, with blacks having a higher mean than whites). 12.22. (a) The response variable is hourly wage. The two factors are sex and whether the job is classified as white-collar, blue-collar, or service jobs. (b) The population mean hourly wages are White-collar Blue-collar Service Males $22 $14 $11 Females $15 $10 $8 (c) (i) For white-collar jobs, the mean hourly wage is $7 more for males than for females. (ii) For bluecollar jobs, the mean hourly wage is $4 more for males than for females. Since this difference is not the same for both job categories, there is evidence of interaction. The disparity between mean hourly wages for males and females increases from $3 for service jobs to $4 for blue-collar jobs to $7 for white-collar jobs. 12.23. (a) The response variable is population median income. The two factors are sex and race. Black White Males $30,886 $40,350 Females $25,736 $29,661 (b) The difference in median income between black males and black females is $5150, while the difference in median income between white males and white females is $10,689. Since this difference in median income is not equal for both races, there is interaction present. (c) One possible set of median incomes would be $35,000 for black males and white males and $30,000 for black females and white females. 12.24. “No interaction” means that the differences in mean political ideology are consistent across religion and also between the sexes. The large difference in sample mean political ideology between Jewish women and Jewish men (compared to the other groups, for which the means are relatively similar) suggests interaction is present. 12.36. The linear regression model assumes a linear relationship between the two variables, whereas the ANOVA model looks for any difference among the means. For example, if the population means on y were 3 when x = 0, 1 when x =1, and 3 when x = 2, there is not a linear trend and the regression model would probably not detect the fact that the population means of y are different 12.38. There is strong evidence of a relationship between the mean number of good friends and how often subjects attend religious services. There is not much difference between the mean number of good friends for those who attend religious services with low or medium frequency, but those who attend religious services with high frequency have a higher mean number of good friends than those in either of the other two groups. 12.40. The P-value had to be less than 0.05/35 = 0.0014 for a given test to be significant. 12.41. For each word type (abstract or concrete), we can conclude that in the population, women have a larger verbal memory, in the sense that the mean for all women is higher than the mean for all men. The lack of interaction suggests that the difference between the population means for women and for men is similar for each word type. 12.42. (a) With the single-comparison approach, in the long run 95% of the intervals will contain the true differences in means. With the multiple comparisons method, in the long run 95% of the time the entire set of comparisons is correct, and any one comparison has confidence greater than 95%. (b) Suppose the sample means equal 8 for A, 15 for B, and 22 for C. 12.44. The response variable is mean number of dates in the past three months. One factor is gender and the other factor is attractiveness. These data do appear to show interaction between gender and attractiveness, because the mean number of dates was very similar for the two attractiveness groups for males but very different for females. 12.45. a. 10 10 b. 10 20 c. 10 20 d. 10 10 20 20 30 40 30 60 10 10 12.48. (a) Science Humanities Women 80,000 (5) 66,000 (25) Men 79,000 (30) 65,000 (20) The overall means (weighted averages) are $68,333 for women and $73,400 for men. The mean is higher overall for men even though it is lower in each division. (b) Controlling for division, women have the higher mean, whereas for a one-way analysis ignoring division, men have the higher mean. 12.51. (a), (b), (c), and (d) 12.52. (c) 12.53. (c), (e), and (f) 12.57. (a) This is the sample variance of the g sample mean values, and we know the theoretical variance of the sampling distribution of the sample mean equals the population variance divided by the sample size. (b) Multiply both sides by n in part (a).


