WWW.COLLEGERESULTS.ORG | JANUARY 2010 Top Gainers
advertisement
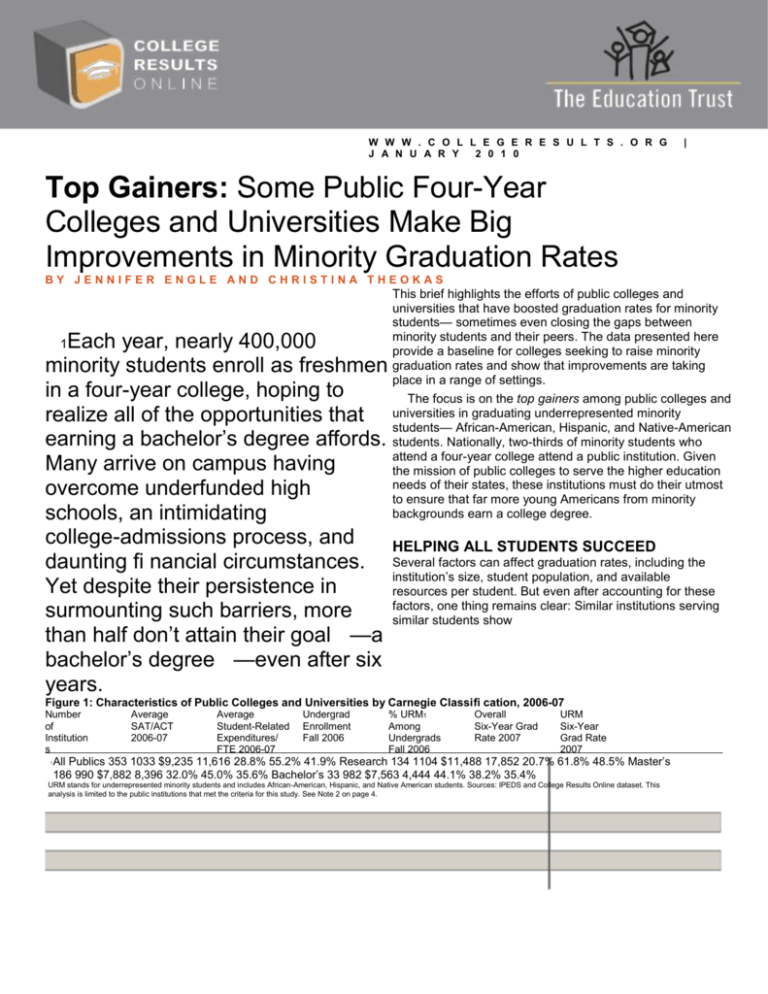
W W W . C O L L E G E R E S U L T S . O R G J A N U A R Y 2 0 1 0 | Top Gainers: Some Public Four-Year Colleges and Universities Make Big Improvements in Minority Graduation Rates BY JENNIFER ENGLE AND CHRISTINA THEOKAS This brief highlights the efforts of public colleges and universities that have boosted graduation rates for minority students— sometimes even closing the gaps between minority students and their peers. The data presented here provide a baseline for colleges seeking to raise minority graduation rates and show that improvements are taking place in a range of settings. The focus is on the top gainers among public colleges and universities in graduating underrepresented minority students— African-American, Hispanic, and Native-American students. Nationally, two-thirds of minority students who attend a four-year college attend a public institution. Given the mission of public colleges to serve the higher education needs of their states, these institutions must do their utmost to ensure that far more young Americans from minority backgrounds earn a college degree. Each year, nearly 400,000 minority students enroll as freshmen in a four-year college, hoping to realize all of the opportunities that earning a bachelor’s degree affords. Many arrive on campus having overcome underfunded high schools, an intimidating college-admissions process, and HELPING ALL STUDENTS SUCCEED daunting fi nancial circumstances. Several factors can affect graduation rates, including the institution’s size, student population, and available Yet despite their persistence in resources per student. But even after accounting for these factors, one thing remains clear: Similar institutions serving surmounting such barriers, more similar students show than half don’t attain their goal —a bachelor’s degree —even after six years. 1 Figure 1: Characteristics of Public Colleges and Universities by Carnegie Classifi cation, 2006-07 Number of Institution s 1 Average SAT/ACT 2006-07 Average Student-Related Expenditures/ FTE 2006-07 Undergrad Enrollment Fall 2006 % URM1 Among Undergrads Fall 2006 Overall Six-Year Grad Rate 2007 URM Six-Year Grad Rate 2007 All Publics 353 1033 $9,235 11,616 28.8% 55.2% 41.9% Research 134 1104 $11,488 17,852 20.7% 61.8% 48.5% Master’s 186 990 $7,882 8,396 32.0% 45.0% 35.6% Bachelor’s 33 982 $7,563 4,444 44.1% 38.2% 35.4% URM stands for underrepresented minority students and includes African-American, Hispanic, and Native American students. Sources: IPEDS and College Results Online dataset. This analysis is limited to the public institutions that met the criteria for this study. See Note 2 on page 4. wide disparities in bachelor-degree attainment. What colleges do to help their students succeed, the data reveal, matters a lot. 2To account for some of the main differences among public colleges, this analysis groups these colleges by Carnegie classifi cation—Research, Master’s, or Bachelor’s.3 (College Results Online, discussed below, further refi nes these groupings). Figure 1 shows that graduation rates typically are higher at research institutions, which tend to enroll more well-prepared students and have more resources per student available to them. Master’s and bachelor’s institutions, on the other hand, tend to serve a more diverse student body with fewer resources per student. These factors contribute to lower graduation rates on average. Some colleges might have made gains as a result of becoming more selective in admissions, rather than improving academically, and the analysis attempts to account for this. But because data to measure selectivity changes were incomplete, we could not control for that. Consequently, we eliminated from this study any college that grew more exclusive by serving signifi cantly fewer minority students among incoming freshmen (a relative decline of 20 percent or more). Looking at the progress minority students have made in public institutions from 2002 to 2007, there is a lot of good news to report. A clear majority of all types of public colleges—about 60 percent—have seen improved graduation rates for minorities. The increases average nearly eight percentage points over fi ve years (see Figures 2 and 3). Some colleges have boosted minority graduation rates considerably more. Twenty-fi ve percent of “gainers” improved by 10 percentage points or more, and 10 percent increased by 15 points or more. Among the top gainers, the graduation rates for minority students rose upwards of 20 points in fi ve years. As the “Top Gainers” lists show (see Figures 4-6), these improvements are taking place in colleges all across the country—from the University of Nebraska-Lincoln and the University of Utah in the West to the University of 4 Gains and Losses in Underrepresented Minority (URM) Graduation Rates in Public Colleges, 2002-07 Figure 2: Percentage of Public Figure 3: Average Increase in URM Colleges With URM Graduation Rate Graduation Rates in Public Colleges That Gains or Losses Made Gains 58% 62% 60% Bachelor’s 5.8% Master’s 7.8% Research 7.0% 7.8 % 100% 80 12% 61% 11% 9% 60 31% 40 10% 30% 20 All Publics 27% 29% 0% All Publics Bachelor’s Master’s Research Loss Same Gain 0 4 % % 5 1 6 2 7 3 8 Average Gain Among Gainers Source: IPEDS and College Results Online data set. Notes: In Figure 2, colleges with graduation rates that were within +/- 1 percent from 2002 to 2007 were coded as "same.” This analysis is limited to the public institutions that met the criteria for this study. See Note 2 on page 4. About College Results Online College Results Online (www.collegeresults.org) is an interactive tool designed to provide information about graduation rates for most four-year colleges and universities. CRO allows users to: Examine graduation rates and see how these rates have changed over time. Compare graduation rates of similar colleges serving similar students. Learn about colleges’ track records in graduating diverse groups of students. Some colleges do a much better job of graduating students than others. At many colleges, signifi cant gaps exist in graduation rates between white students and students of color. But some colleges are proving that low graduation rates—especially for minority students—are not inevitable. 2 THE EDUCATION TRUST | TOP GAINERS IN UNDERRE PRESENTED MINORITY GRADUA TION RATES | JANUARY 2010 Louisville and North Carolina State University-Raleigh in the South. Small comprehensive institutions such as Kutztown University in Pennsylvania and large research universities such as Ohio State University and Florida State University also have posted gains (see the sidebar on this page). Some top gainers, such as the University of Wisconsin-Madison, serve proportionately small minority populations but have experienced large improvements among minority students. Others, such as Georgia State University and Savannah State University, enroll large proportions of minority students. Georgia State, a research university in downtown Atlanta, enrolls approximately 19,000 undergraduates—more than one-third minorities, mostly African-Americans. The university ranks fi fth nationwide in the number of bachelor’s degrees granted to African-American students, according to Diverse magazine. From 2002 to 2007, the minority graduation rate at Georgia State rose by 18.4 percentage points, from 32.3 percent to 50.7 percent. Today, the university’s minority students graduate at higher rates than their nonminority peers. This improvement has not come at the expense of other students, however. Graduation rates also grew 11.9 points overall and 8.1 points among nonminority students from 2002 to 2007. At the same time, Georgia State’s enrollment grew more diverse as well, with minority enrollment increasing from 30 percent in 1996, when the class of 2002 entered, to 36 percent in 2001, when the 2007 graduates enrolled. Georgia State made these gains by focusing fi rst and foremost on the data, says Ron Henry, former provost and senior vice president for academic affairs. Henry and his colleagues used data to identify various potholes on the path to a bachelor’s degree for GSU students—from high failure rates in introductory courses and low levels of credit accumulation in the fi rst year to high dropout rates between the sophomore and junior year when students transition to their major. Although Georgia State took an institutionwide approach to improving student success at these critical junctures, administrators found that some programs actually were most effective for minority students. Using program evaluation data disaggregated by race, GSU offi cials learned that fi rst-year learning communities, for example, were instrumental in lifting freshmen-to-sophomoreyear retention rates by a respectable fi ve to six percentage points for all students. For minority students, retention rates rose an impressive ten to 12 percentage points. Georgia State’s example demonstrates that public institutions can foster access and strive for excellence simultaneously. They do not face an either-or choice. About four hours southeast from Atlanta, Savannah State University is a small HBCU (Historically Black College or University). The school enrolls about 3,000 undergraduate students, nearly all of whom are African American, two-thirds of whom are from low-income families. For years, the school’s graduation rate hovered near 20 percent, among the lowest rates among the 105 HBCUs. In the fi ve years after 2002, however, graduation rates for minority students at Savannah State rose dramatically— from 17.8 percent to 40.8 percent. The institution not Ohio State University and Florida State University, have been recognized for model programs that boost retention and graduation rates among underrepresented populations. At Florida State, the Center for Academic Retention and Enhancement (C.A.R.E.) has been credited with helping improve graduation rates among minority students. Figure 4 shows that FSU not only posted sizeable gains in its minority graduation rate from 2002 to 2007, but it also completely closed the achievement gap between minority students and their peers. Founded in 2002, C.A.R.E. supports minority students all along the pipeline to college. Its programs reach out to high school students seeking help in the admissions and fi nancial aid processes and include orientation, advising, and tutoring for those who enroll. For more information, visit http:// care.fsu.edu. iiAlthough they still lag behind their peers, minority students at Ohio State University have improved their graduation rates by 10.1 percentage points since 2002. The university’s Todd Anthony Bell National Resource Center on the African American Male is considered an important part of the institution’s strategy to improve minority graduation rates, particularly among males. The center sponsors programs aimed at better connecting African-American males with the campus, including early arrival freshman orientation, faculty and peer mentoring, and “intrusive” advising. Offi cials credit the program with signifi cantly boosting the rate at which African-American males return for their second year. The rate rose from 69 percent in 2001 to 91 percent in 2008. For more information, visit http://oma.osu.edu/ current-students/bell-resource-center. i Carey, K. (2008). “Graduation Rate Watch: Making Minority Student Diverse Issues in Higher Education. Success a Priority.” Washington, D.C.: Education Sector. http://diverseeducation.com/article/12277/ ii. Nealy, M. (February 11, 2009). “Black Males Achieving More on Campus.” black-males-achieving-more-on-college-campuses.html. T H E E D U C A T I O N T R U S T | T O P G A I N E R S I N U N D E R R E P R E S E N T E D M I N O R I T Y G R A D U A T I O N R A T E S | JANUARY 2010 3 i. only ranks among the top gainers in public colleges, but from 2002 to 2007 it also was the second highest gainer among all public and private HBCUs nationally. Today, its minority students graduate at nearly the same rate—41.9 percent—as minority students at all public colleges. Carlton Brown, former Savannah State president, says the turnaround in graduation rates came about because educators worked hard to build a community of success. When he arrived in 1997, Brown and his colleagues started by renovating dilapidated residence halls and academic buildings to create a campus environment that made students feel proud. At the same time, they set out to foster deeper engagement among students and between students and faculty. In fact, a commitment to close personal communication with students is now part of the hiring and performance criteria for faculty. Says Brown: “We created an experience that was so intense, so deep, and made the place so important to them that students couldn’t imagine not being there.” an Early Assessment Program administers a collegeplacement test to high school juniors and then provides assignments and other support in the senior year to prepare students for college-level coursework. 5 Focus resources on the fi rst year of college, when half of all dropouts leave, by implementing programs aimed at easing students’ transition to academic life. Programs such as “summer bridge,” freshmen orientation, and learning communities help students acquire the skills they need to succeed in college. Improve teaching in “gate keeping” remedial and introductory courses. Hundreds of colleges and universities nationwide have redesigned these courses, using the proven technology-driven approach developed by the National Center for Academic Transformation. Others have added peer-led supplemental instruction. 6 Closely monitor student progress through “intrusive” advising programs and early warning systems that connect students with the support services they need—tutoring, study skills, counseling—to get back on track with their studies. 7 Target institutional grant aid to meet the full fi nancial need of low-income students fi rst and foremost—rather than using scarce resources as merit aid to attract students who would attend college regardless and graduate without the aid. FOLLOWING THE LEADERS The public institutions highlighted in this brief offer evidence that low graduation rates for minority students are not inevitable and that considerable gains are possible. What can other institutions do to follow their examples and improve success rates? Here are some strategies research shows may prove valuable: Partner with area high schools to improve students’ Jennifer Engle is assistant director of higher education, and Christina Theokas is director of research at The Education Trust. © Copyright college-readiness. At California State University, 2010 The Education Trust. NOTES Ed Trust analysis of BPS:96/01 data using the Data Analysis System online. 1 In our sample for these analyses, colleges with a relative decline of 20 percent or more in the percentage of underrepresented minorities among incoming freshmen fell beyond one standard deviation among all public colleges on this measure, indicating that they experienced declines that were much greater than the sample average. 4 The sample for this analysis includes public four-year institutions with complete graduation-rate data in both study years (2002 and 2007) and with a cohort of at least 30 underrepresented minority 5 Smith, B.L., MacGregor, J., Matthews, R., and Gabelnick, F. (2004). students, the minimum number of cases required by accepted statistical standards. The sample also excludes institutions that served Learning Communities: Reforming Undergraduate Education. San signifi cantly fewer underrepresented minority students—a relative Francisco: Jossey-Bass. Upcraft, M.L., Gardner, J.N. & Barefoot, B.O. decline of 20 percent or more—among incoming freshmen in the study (2005). Challenging and Supporting the First-Year Student. San years (incoming 1996 and 2001) in order to eliminate institutions Francisco: Jossey-Bass Higher Education Series. whose graduation rates improved as a result of serving fewer minority 6 Engle, J. and O’Brien, C. (2007). Demography Is Not Destiny: students. Increasing the Graduation Rates of Low-Income College Students at 3 For more than three decades, the Carnegie Classifi cation Large Public Universities. Washington D.C.: The Pell Institute. Kuh, has been the leading framework for describing institutional G.D., Kinzie, J., Schuh, J.H., Whitt, E.J., & Associates. (2005). diversity in U.S. higher education. It has been widely used in Student Success in College: Creating Conditions That Matter. San the study of higher education, both as a way to represent and Francisco: Jossey-Bass. control for institutional differences, as well as in the design of 7 Haycock, K., Lynch, M., and Engle, J. (2010). “Opportunity Adrift: research studies to ensure adequate representation of sampled Our Flagship Universities Are Straying From Their Public Mission.” institutions, students, or faculty. http://classifi Washington D.C.: The Education Trust. cations.carnegiefoundation.org. 4 T H E E D U C A T I O N T R U S T | T O P G A I N E R S I N U N D E R R E P R E S E N T E D M I N O R I T Y G R A D U A T I O N R A T E S | JANUARY 2010 2 Figure 4: Top 25 Gainers in Underrepresented Minority Graduation Rates Among Public Research Universities, 2002-07 Undergra d Enrollme nt Fall 2006 % URM Among Undergrads Fall 2006 Overall SixYear Grad Rate 2007 URM SixYear Grad Rate 2002 URM SixYear Grad Rate 2007 Change in URM Grad Rates 2002-07 Michigan Technological University (MI) 5,630 4.2 63.5 41.9 60.9 19.0 Georgia State University (GA) 19,109 34.7 47.2 32.3 50.7 18.4 University of Louisville (KY) 14,995 14.7 43.7 19.9 37.1 17.2 University of Utah (UT) 23,983 6.0 56.0 29.6 46.6 17.0 University of Missouri-St Louis (MO) 12,459 15.7 43.3 16.5 33.3 16.8 George Mason University (VA) 18,221 14.8 58.3 46.5 62.2 15.7 Missouri University of Science and Tech (MO) 4,515 7.1 60.9 42.1 57.5 15.4 University of California, Santa Barbara (CA) 18,212 22.2 79.9 62.0 75.2 13.2 University of Nebraska-Lincoln (NE) 17,371 6.0 63.4 34.0 46.7 12.7 University of Georgia (GA) 25,437 8.1 77.0 62.8 74.6 11.8 University of Wisconsin-Madison (WI) 29,639 6.3 79.0 48.9 60.4 11.5 University of Oklahoma Norman Campus (OK) 19,573 16.5 60.7 42.3 53.7 11.4 University of Minnesota-Twin Cities (MN) 32,113 7.5 63.4 32.4 43.8 11.4 University of Maryland, College Park (MD) 25,154 18.8 79.9 58.1 69.4 11.3 University of Oregon (OR) 16,529 6.5 65.3 56.3 67.1 10.8 Ohio University-Main Campus (OH) 17,026 5.9 70.3 52.9 63.5 10.6 North Carolina State University at Raleigh (NC) 23,730 12.2 69.7 47.5 58.1 10.6 Ohio State University-Main Campus (OH) 38,479 10.1 71.4 43.7 54.0 10.3 Iowa State University (IA) 20,440 5.5 65.8 42.0 51.8 9.8 University of Texas at Arlington (TX) 19,205 29.7 37.2 27.2 36.8 9.6 University of South Florida (FL) 34,438 24.7 49.3 40.9 50.3 9.4 University of Maryland, Baltimore County (MD) 9,416 18.9 60.5 54.2 63.5 9.3 University of Texas at Austin (TX) 37,037 22.0 77.6 60.9 70.2 9.3 University of Pittsburgh-Pittsburgh Campus (PA) 17,246 10.1 75.1 51.2 60.5 9.3 Florida State University (FL) 31,347 22.9 68.7 60.0 69.0 9.0 Sources: IPEDS and College Results Online data set. Note: Institutions are grouped by their 2000 Carnegie code to correspond to their classifi cation during the study period. A small number of institutions have changed classifi cations since then. THE EDUCATION TRUST | JANUARY 2010 5 TOP GAINERS IN UNDERREPRESENTED M INORITY GRADUATION RATES | Figure 5: Top 25 Gainers in Underrepresented Minority Graduation Rates Among Public Master’s Institutions, 2002-07 Undergra d Enrollme nt Fall 2006 % URM Among Undergrads Fall 2006 Overall SixYear Grad Rate 2007 URM Six-Year Grad Rate 2002 URM SixYear Grad Rate 2007 Change in URM Grad Rates 2002-07 Western Oregon University (OR) 4,183 9.6 45.5 17.5 42.3 24.8 Eastern Kentucky University (KY) 13,623 5.1 38.9 13.8 38.5 24.7 Savannah State University (GA) 3,109 96.4 40.5 17.8 40.8 23.0 Worcester State College (MA) 4,626 8.2 39.9 9.1 30.6 21.5 Westfi eld State College (MA) 4,703 5.5 55.7 41.2 60.8 19.6 Kutztown University of Pennsylvania (PA) 9,189 11.5 54.6 27.9 46.9 19.0 Wayne State College (NE) 2,748 6.1 46.1 14.0 32.5 18.5 Towson University (MD) 15,374 13.7 66.4 47.3 64.4 17.1 Appalachian State University (NC) 13,447 5.4 62.6 44.2 61.0 16.8 Albany State University (GA) 3,515 96.1 41.4 25.6 41.8 16.2 Northwestern State University of Louisiana (LA) 8,248 34.5 37.9 18.9 34.7 15.8 Adams State College (CO) 2,809 35.7 32.0 18.9 34.4 15.5 University of Montevallo (AL) 2,463 15.4 47.1 35.8 51.3 15.5 Ferris State University (MI) 11,413 7.8 37.2 5.6 20.9 15.3 Valdosta State University (GA) 9,489 25.5 41.1 26.8 41.5 14.7 Montclair State University (NJ) 12,365 28.3 61.2 40.9 54.9 14.0 University of Southern Indiana (IN) 9,298 6.2 30.7 4.7 18.7 14.0 California State University, Northridge (CA) 28,491 38.7 40.5 21.5 35.4 13.9 California State University, 23,928 23.1 42.4 22.3 36.1 13.8 Sacramento (CA) Columbus State University (GA) 6,754 37.0 32.3 12.0 25.5 13.5 CUNY Brooklyn College (NY) 12,111 37.8 46.8 28.7 41.8 13.1 University of Wisconsin-La Crosse (WI) 8,341 2.9 65.9 36.4 48.8 12.4 University of Minnesota-Duluth (MN) 10,076 2.9 49.6 16.7 28.6 11.9 Georgia Southern University (GA) 14,483 23.2 45.1 37.9 49.5 11.6 Lock Haven University of Pennsylvania (PA) 4,890 8.6 50.8 24.2 35.7 11.5 Sources: IPEDS and College Results Online data set. Note: Institutions are grouped by their 2000 Carnegie code to correspond to their classifi cation during the study period. A small number of institutions have changed classifi cations since then. 6 THE EDUCATION TRUST | JANUARY 2010 TOP GAINERS IN UNDERRE PRESENTED MINORITY GRADUATION RATES | Figure 6: Top Gainers in Underrepresented Minority Graduation Rates Among Public Bachelor’s Institutions, 2002-071 Undergrad Enrollment Fall 2006 % URM Among Undergrads Fall 2006 Overall Six-Year Grad Rate 2007 URM Six-Year Grad Rate 2002 URM Six-Year Grad Rate 2007 Change in URM Grad Rates 2002-07 SUNY College at Old Westbury (NY) 3,411 46.8 35.9 19.9 38.8 18.9 University of Puerto Rico in Ponce (PR) 3,265 100.0 51.4 34.1 51.5 17.4 University of South Carolina Aiken (SC) 3,241 28.6 40.9 24.6 38.4 13.8 U 4,183 6.3 75.7 53.5 64.8 11.3 n State College (CO) 6,126 12.1 40.6 25.4 34.3 8.9 University of South Carolina Upstate (SC) 4,574 28.8 Mesa i 32.2 40.9 8.7 38.3 v e r s i t y o f M a r y W a s h i n g t o n Richard Stockton College of New Jersey (NJ) ( V A ) 6,726 13.7 67.8 51.0 58.5 7.5 Metropolitan State College of Denver (CO) 21,154 19.3 23.0 16.0 22.2 6.2 University of Arkansas at Pine Bluff (AR) 3,051 96.0 32.9 27.4 33.0 5.6 3,405 33.1 36.1 31.5 36.7 5.2 California State University, Monterey Bay (CA) Sources: IPEDS and College Results Online data set. Note: Institutions are grouped by their 2000 Carnegie code to correspond to their classifi cation during the study period. A small number of institutions have changed classifi cations since then. There were not 25 public bachelor’s colleges that had increased their graduation rates for underrepresented minority students from 2002 to 2007, so only the colleges that had increases near or above the average gain among all bachelor’s colleges are listed here. 1 The Education Trust promotes high academic achievement for all students at all levels—prekindergarten through college. We work alongside parents, educators, and community and business leaders across the country in transforming schools and colleges into institutions that serve all students well. Lessons learned in these efforts, together with unfl inching data analyses, shape our state and national policy agendas. Our goal is to close the gaps in opportunity and achievement that consign far too many young people—especially those who are black, Latino, American Indian, or from low-income families—to lives on the margins of the American mainstream. The Education Trust is grateful to Lumina Foundation for Education for generously supporting our work. The views expressed in this publication are those of the authors and do not necessarily represent those of the foundation, its offi cers, or employees. 1 2 5 0 H S T R E E T N. W . , S U I T E 7 0 0 W AS H I N G T O N , D . C. 2 0 0 0 5 T 2 0 2/ 2 9 3 - 12 1 7 F 202/293-2605 WWW.EDTRUST.ORG
