Exam 1 Answer Key
advertisement
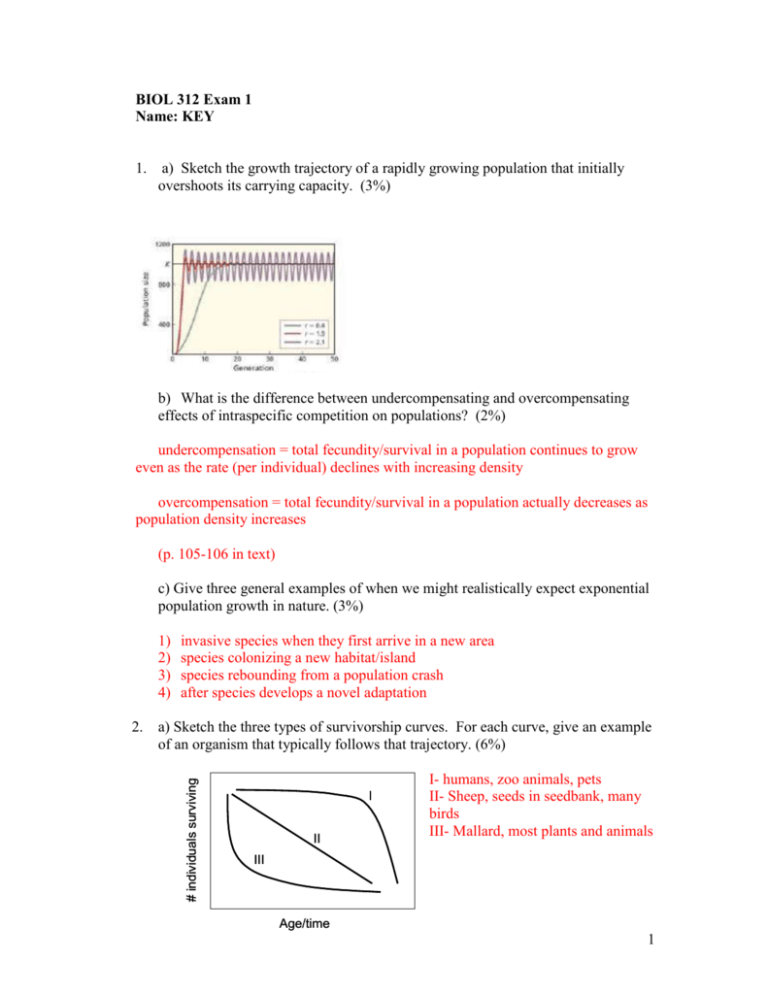
BIOL 312 Exam 1 Name: KEY 1. a) Sketch the growth trajectory of a rapidly growing population that initially overshoots its carrying capacity. (3%) b) What is the difference between undercompensating and overcompensating effects of intraspecific competition on populations? (2%) undercompensation = total fecundity/survival in a population continues to grow even as the rate (per individual) declines with increasing density overcompensation = total fecundity/survival in a population actually decreases as population density increases (p. 105-106 in text) c) Give three general examples of when we might realistically expect exponential population growth in nature. (3%) 1) 2) 3) 4) a) Sketch the three types of survivorship curves. For each curve, give an example of an organism that typically follows that trajectory. (6%) # individuals surviving 2. invasive species when they first arrive in a new area species colonizing a new habitat/island species rebounding from a population crash after species develops a novel adaptation I II I- humans, zoo animals, pets II- Sheep, seeds in seedbank, many birds III- Mallard, most plants and animals III Age/time 1 b) How might increased population density affect the shape of the survivorship curve for a given population that typically experiences a Type 1 curve? (2%) increase juvenile mortality shift curve more to type II or III (p. 169-170 in book) 3. Describe the scientific process (method). Include the key steps, starting points, and alternate possibilities. (10%) Below is the conceptual flow diagram that we discussed in class. I expected that your answer would include most of the critical steps. You should have also indicated by arrows or in your discussion that this is not a linear process but a cycle with multiple entry points (e.g. observation in the field or interesting pattern in someone else’s data). Some of you said that hypotheses were tested by controlled experiments, but this is not always the case. Many times hypotheses are tested by observational studies because experiments are impossible. The Scientific Method (Cycle) Observations Speculate: Apply inductive & deductive reasoning to observations. Compare with current theories Formulate hypothesis More predictions, tests, theory development Predict results assuming hypothesis is correct Reevaluate observations and theory Design a test of predictions Results support hypothesis Independent verification of results (reproducible) 4. Results do not support hypothesis After Gurevitch et al. 2002 What is a metapopulation? (2%) a population of populations, or more generally any spatially structured population b) Describe the difference between the classical and core-satellite models of metapopulations. (6%) classical- many small local populations (of equal size) that all have equal migration between them and an equal risk of local extinction core-satellite- at least one local population is very large (mainland-island) or has positive population growth (source-sink) with little or no probability of extinction; migration occurs from the large population to the smaller ones 2 5. a) In class we discussed three general conservation concerns associated with habitat fragmentation. Name two of these concerns and describe why they increase the probability of population extinction. (6%) 1) reduced patch sizes increases extinction probability due to genetic and random population processes 2) increased habitat edges increases vulnerability, alters habitat suitability 3) increased isolation reduced immigration b) Habitat fragmentation can lead to evolution of new species if populations are isolated for long periods of time. Describe an experiment that would show whether the building of a strip mall on a hillside 20 years ago had resulted in evolution of the two subpopulations of plants that were created as a consequence of the mall. (6%) before after Hillside Mall Any description of a common garden experiment or reciprocal transplant experiment (see p. 44-46 in text) got full credit. Partial credit for mentioning crossfertilizing to examine vigor of offspring. 3 6. I often get e-mail notices about conservation issues. This one recently came through my inbox: “The Florida Fish and Wildlife Conservation Commission is recommending that manatees be downlisted from endangered to threatened status on the state level. However, last year was the second highest manatee mortality year on record! Manatees are poised to be downlisted because of a calculated effort by special interest groups opposed to boat speed zones and restrictions on development. Urge Governor Bush to keep protections for the manatee in place!” Based on your knowledge of factors important to population dynamics, what key information is missing from this notice? (4%) *Birth rate* and any one of the following: migration rates, population size, age of dying animals 7. In class we discussed three types of life-history tradeoffs: growth vs. reproduction, number of offspring vs. fitness of offspring, and semelparity vs. iteroparity. Describe how traits within each tradeoff create the distinction between ‘r’ and ‘K’ life history strategies. (12%) r K_____ -mature faster, smaller body size -mature later, bigger size at maturity -have large numbers of small (low fitness offspring) -have a few, large (high fitness) offspring; lots of parental investment -tends toward semelparity (just a few, large reproductive periods) -tends toward iteroparity (many smaller reproductive efforts) 4 8. In a few sentences, describe Grime’s ‘CSR’ concept of life-history strategies. (6%) -alternative to r-K categories for PLANTS -“Competitors”, “Stress-tolerators”, and “Ruderals” -categorizes plants in their competitive ability, their stress tolerance, and their response to disturbance 9. Census data for a gray squirrel population from North Carolina are shown below. a) Using the equations and data provided, calculate the intrinsic rate of increase for this population. Is this population increasing or decreasing in size? (8%) r = 0.041, increasing (r > 0) b) How much longer would we expect a 4-year-old squirrel in this population to live? (4%) 1.9 (or close to 2) years Age (x) 0 1 2 3 4 5 6 7 8 Σ # of indivs. 1000 253 116 89 58 39 25 22 0 lx bx lxbx xlxbx Lx Tx ex 1.0 .253 .116 .089 .058 .039 .025 .022 0 0 1.28 2.28 2.28 2.28 2.28 2.28 2.28 0 0 .324 .264 .203 .132 .089 .057 .050 0 1.12 0 .324 .528 .609 .528 .445 .342 .35 0 3.13 .63 .18 .10 .07 .05 .03 .02 .01 0 1.09 1.09 .46 .28 .18 .11 .06 .03 .01 0 1.09 1.81 2.41 2.02 1.90 1.54 1.2 0.45 0 lx = proportion of cohort surviving to age x = #indivs(age x)/#indivs(age 0) Net reproductive rate = R0 = ∑lxbx Generation time = G = (∑xlxbx)/(∑lxbx) Intrinsic rate of increase = r = lnR0 /G Life expectancy = ex = Tx/lx Tx = ∑Lx Lx = (lx + lx+1)/2 5 10. Recently, we read a paper by Kuussaari et al. (1996) that studied the migration of the Glanville fritillary butterfly in Finland. Name three factors they found to influence emigration and describe how these factors affected emigration (e.g. increased/decreased emigration). (6%) -nectar sources more flowers/more food sources (better habitat quality) led to decreased emigration -patch boundaries more open habitat led to increased emigration -population density higher densities led to decreased emigration -patch size smaller patches had increased emigration -butterfly size larger females had increased emigration -sex females had higher emigration rates than males -time emigration fraction increased through time 11. Explain the difference between ecology and environmentalism. (4%) The major difference is that ecology is a SCIENCE (test ideas with data) while environmentalism is a philosophical world-view that usually includes advocacy. 12. Compare and contrast each of the following: lab experiment (LE), field experiment (FE), trajectory study (TS), and natural snapshot study (NSS). Discuss the strengths and weaknesses of each. (10%) LE provide the highest level of control of variables (high causal inference), but has the lowest realism. FE is more realistic than LE while retaining some control (high causal inference) of variables. TS has high realism including detection of changes over time but poor control of variables (weak causal inference). NSS has high realism but weak causal inference and cannot detect changes over time. 6
