Linear Nonlinear Relationships Day 2
advertisement

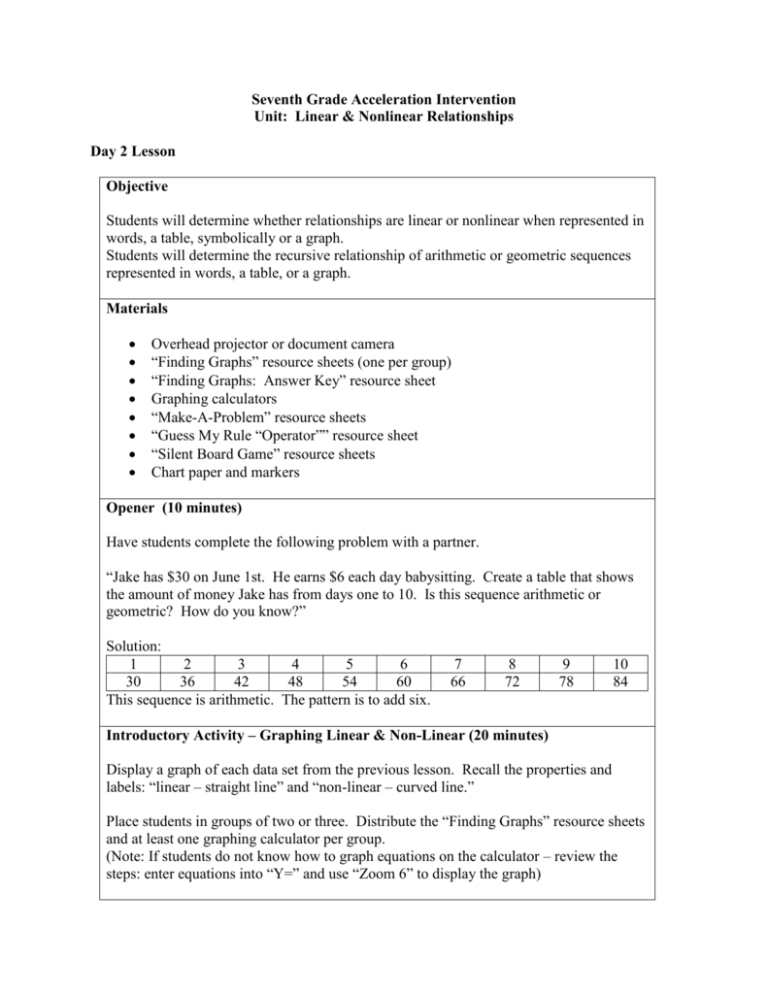
Seventh Grade Acceleration Intervention Unit: Linear & Nonlinear Relationships Day 2 Lesson Objective Students will determine whether relationships are linear or nonlinear when represented in words, a table, symbolically or a graph. Students will determine the recursive relationship of arithmetic or geometric sequences represented in words, a table, or a graph. Materials Overhead projector or document camera “Finding Graphs” resource sheets (one per group) “Finding Graphs: Answer Key” resource sheet Graphing calculators “Make-A-Problem” resource sheets “Guess My Rule “Operator”” resource sheet “Silent Board Game” resource sheets Chart paper and markers Opener (10 minutes) Have students complete the following problem with a partner. “Jake has $30 on June 1st. He earns $6 each day babysitting. Create a table that shows the amount of money Jake has from days one to 10. Is this sequence arithmetic or geometric? How do you know?” Solution: 1 2 3 4 5 6 30 36 42 48 54 60 This sequence is arithmetic. The pattern is to add six. 7 66 8 72 9 78 10 84 Introductory Activity – Graphing Linear & Non-Linear (20 minutes) Display a graph of each data set from the previous lesson. Recall the properties and labels: “linear – straight line” and “non-linear – curved line.” Place students in groups of two or three. Distribute the “Finding Graphs” resource sheets and at least one graphing calculator per group. (Note: If students do not know how to graph equations on the calculator – review the steps: enter equations into “Y=” and use “Zoom 6” to display the graph) Have students complete this activity with their group. As a class, discuss the different features of the graphs. Include a discussion of how the different equations resulted in graphs of different shapes. Think about the following questions: 1. What did the equations look like when a graph was linear? 2. What types of equations resulted in non-linear graphs? 3. Did all non-linear graphs look alike? Do you notice a pattern between the type of equation and the shape of graph it creates? Make-A-Problem (20 minutes) Assign students to pairs and give each pair a graphing calculator. Each pair of students should create six equations and sketch the graph from the calculator – three linear and three nonlinear. They may use the previous activity as inspiration for their equations. After each pair has sketched their six graphs, form groups of four and have students exchange problems and indicate whether each graph is linear or non-linear. Students should return problems to their authors to be checked. Monitor groups for accuracy and creativity with graphs and equations. Share any interesting problems with the class. Guess My Rule (20 minutes) Post or draw the “Operator” on the board or overhead. Explain to the students that they are going to input numbers into the “Operator” and guess what the “Operator” is doing to that number, based on the output. Draw an input/output table on the board. Using the equations provided, walk the students through a few numbers. For example, the equation y 2 x 1 may have the following table: INPUT OUTPUT 2 5 5 11 10 21 … … Give the students the first few inputs and their corresponding outputs, and then allow students to give you their own numbers as inputs, filling in the outputs for them. Eventually, students should be able to talk through what is happening to the input. Students may say “it’s doubling and then going up by one,” or “you multiply the number by 2 and add 1.” Eventually, you may be able to give them an input and have them produce the output on their own. Draw another input/output table on the board and repeat the process with a new rule. Once it is clear that students are able to explain, in words, what is happening in the “Operator,” for the different tables, have them talk through how they might write an equation/expression to represent each rule. For example, 2(input) + 1 = output would be come y = 2x + 1. Rules: 2x + 1, 3x + 2, 2x – 1 (Note: Tables will vary based on the numbers generated by students.) Silent Board Game (15 minutes) Draw each table on a separate piece of chart paper. Post one of the pieces of chart paper in the front of the room. Students are to remain silent and examine the rule being presented. When students feel they have figured out the pattern, they can raise their hands. When you call on a student, he/she should silently go to the board and write a new x- and y-value (input/output) that fits the rule. If that student is correct, let them know and tell them to sit down with their thumbs up. Continue to allow the students to silently analyze the pattern being formed. As students figure it out and raise their hands, allow them to come up and add their own x- and y-values. When it seems as though many of the students have figured out the rule (based on “thumbs-up” and raised hands), allow one student that already has their thumbs up to explain the pattern/rule to the class. Post a new piece of chart paper with a new pattern over the old one and start over. Closure (5 minutes) Discuss the following questions, as a class, in regards to one of the tables from the Silent Board Game: 1. Based on the table, what type of graph would you expect? Explain why. (Some students may notice that the pattern increases by the same amount, others may note that the equations had the same format as the linear equations in the “Finding Graphs” activity.) 2. How does the rule you came up with for this particular pattern correspond with the pattern in the table? (Students may notice that the number they multiply x by is the same as the amount by which y increases. They also may notice that the initial value is the other value in the rule.) If time permits, graph the table of values you have discussed on a piece of chart paper. Finding Graphs Directions: Enter each equation into the graphing calculator and sketch the graph that is shown. Indicate whether each graph is linear or non-linear. a. y 7 x 8 b. y 2 x 2 1 Linear / Non-Linear Linear / Non-Linear d. y x 3 5 e. y Linear / Non-Linear 1 x4 2 Linear / Non-Linear c. y 5 x Linear / Non-Linear f. y 31x Linear / Non-Linear Finding Graphs: Answer Key Directions: Enter each equation into the graphing calculator and sketch the graph that is shown. Indicate whether each graph is linear or non-linear. y 7x 8 y 2x 2 1 Linear y x3 5 Non-Linear y y 5 x Non-Linear Non-Linear 1 x4 2 y 3 2x Linear Non-Linear Make-A-Problem Equation Equation Equation ______________ _____________ ___________ Linear / Non-Linear Linear / Non-Linear Linear / Non-Linear Equation ______________ Linear / Non-Linear Equation _____________ Linear / Non-Linear Equation ___________ Linear / Non-Linear Guess My Rule “Operator” INPUT OPERATOR OUTPUT Silent Board Game x y 0 1 2 7 2 12 3 17 4 5 6 7 8 RULE: y = 5x + 2 x y 0 1 3 5 2 7 3 9 4 5 6 7 8 RULE: y = 2x + 3 x y 0 1 –2 1 2 4 3 7 4 5 6 7 8 RULE: y = 3x – 2 x y 0 1 3 13 2 23 3 33 4 5 6 7 8 RULE: y = 10x + 3


