Operations and Production Management
MGMT 405
Answer set 5
MGMT 405 Operations and Production Management
Answer set 5
(Reference chapters 12– William J. Stevenson-2007, ninth edition)
Problems
1. The manager of an automobile repair shop hopes to achieve a better
allocation of inventory control efforts by adopting an ABC approach to
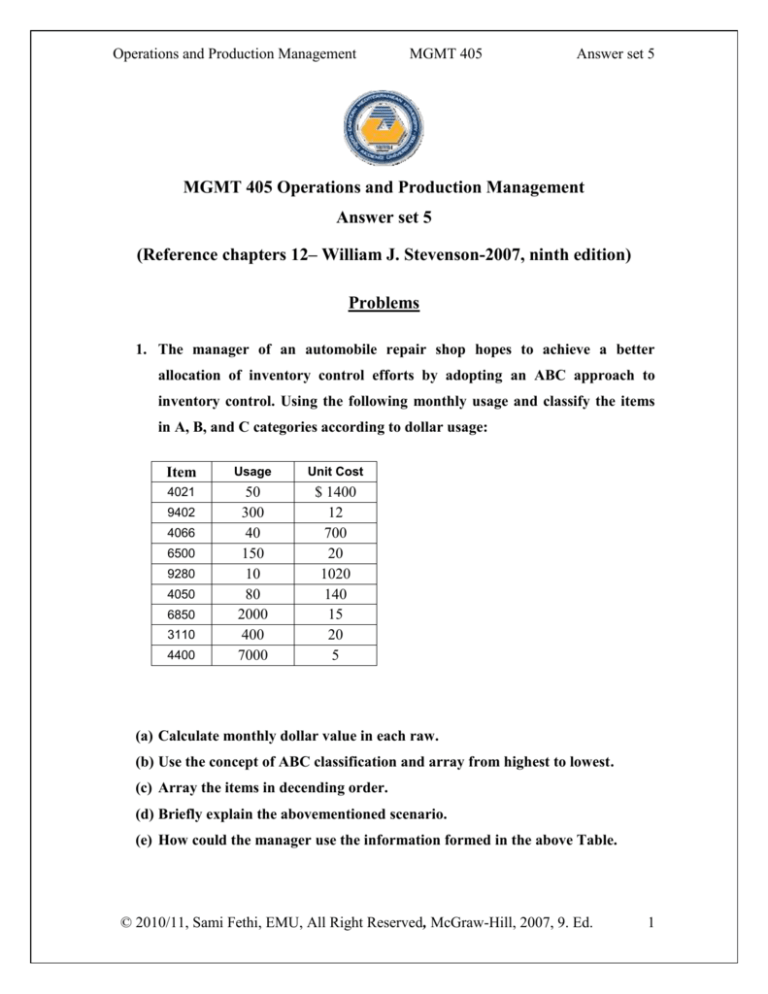
inventory control. Using the following monthly usage and classify the items
in A, B, and C categories according to dollar usage:
Item
Usage
Unit Cost
4021
50
300
40
150
10
80
2000
400
7000
$ 1400
12
700
20
1020
140
15
20
5
9402
4066
6500
9280
4050
6850
3110
4400
(a) Calculate monthly dollar value in each raw.
(b) Use the concept of ABC classification and array from highest to lowest.
(c) Array the items in decending order.
(d) Briefly explain the abovementioned scenario.
(e) How could the manager use the information formed in the above Table.
© 2010/11, Sami Fethi, EMU, All Right Reserved, McGraw-Hill, 2007, 9. Ed.
1
Operations and Production Management
MGMT 405
Answer set 5
(f) After reviewing your classification scheme, suppose that the manager decides
to place 4400 into the A category. What may be some possible explanations
for this decision?
ANS:
(a) and (b)
Item
Usage
Unit Cost
4021
50
300
40
150
10
80
2000
400
7000
1400
12
700
20
1020
140
15
20
5
9402
4066
6500
9280
4050
6850
3110
4400
Usage X Unit Cost
Category
70000
A
3600
C
28000
B
3000
C
10200
C
11200
C
30000
B
8000
C
35000
B
(c ) In descending order
Item
4021
Usage X Unit Cost
70000
Category
A
4400
6850
4066
35000
30000
28000
B
B
B
4050
9280
3110
9402
6500
11200
10200
8000
3600
3000
C
C
C
C
C
d) The first item has relatively high monthly dollar value, so it seems reasonable to
classify them as A item. The next three items appear to have moderate monthly dollar
values and should be classified as B items. The remainder are C items due to their
relatively low monthly dollar value.
© 2010/11, Sami Fethi, EMU, All Right Reserved, McGraw-Hill, 2007, 9. Ed.
2
Operations and Production Management
MGMT 405
Answer set 5
e) To allocate control efforts.
(f) It may be important for some reason other than dollar usage such as cost of a stockout,
usage highly correlated to an A item etc....
2. A bakery buys flour in 25 pound bag. The bakery uses an average an average
of 4860 bags a year. Preparing an order and receving a shipment of flour
involves a cost of $ 10 per order. Annual carring cost is $ 75 per bag.
(a) Determine the EOQ?
(b) What is the average number of bags on hand?
(c) How many orders per year will there be?
(d) Compute the total cost of ordering and carring flour.
(e) How much would that affect the minimum total annual cost if the ordering
costs were to increase by $ 1 per order?
ANS:
(a) D=4860 bags per year, S=$ 10 and H=$ 75
Q
2 DS
2(4860)10
36 bags
H
75
(b) Q/2= 36/2= 18 bags
© 2010/11, Sami Fethi, EMU, All Right Reserved, McGraw-Hill, 2007, 9. Ed.
3
Operations and Production Management
MGMT 405
Answer set 5
(c)
Number of order per year :
4860 bags
D
135 orders
Q 36 bags / order
(d)
TC
36
Q
D
4860
H S
75
75 $ 2700
2
Q
2
36
(e)
Q
2DS
2(4860)11
37.757 bags
H
75
TC
Q
D
37.757
4860
H S
75
11 $ 2831.79
2
Q
2
37.757
Increased by 2831.79-2700= $ 131.79
3. A manufacturer produce x drug in 100-pound bags. Demand for this product
is 20 tons per day. The capacity for producing the product is 50 tons per day.
Setup costs $ 100, storage and handling costs are $ 5 per ton a year. The firm
operates 200 days per year and 1 ton is equal to 2000 pounds.
(a) How many bags per run areOptimal (i.e. run size)?
(b) What would the average inventory be for this lot size?
© 2010/11, Sami Fethi, EMU, All Right Reserved, McGraw-Hill, 2007, 9. Ed.
4
Operations and Production Management
MGMT 405
Answer set 5
(c) Determine the approximate lenght of a production run in days.
(d) About how many runs per year would there be Run time?
(e) How much could the company save annually if the setup cost could be reduced to
$25 per run ?
ANS:
(a)
P= 50 ton/day, time is 200 days, u=20 tons/days, D= 20x200=4000 tons/year ,S=$
100 and H=$ 5 ton per year.
The economic run quantity Q
2DS
H
(2) (4000) (100)
P
50
516.40 tons
P U
5
50 20
Or 516.40x2000= 10328 bags
(b)
I max
Qo
516.40
( p u)
(50 20) 309.84 tons or 6196.8 bags
p
50
I AV
I max Qo
309.84
( p u)
154.92 tons
2
p
2
(c)
Run length
QO 516.4
10.33 days
P
50
© 2010/11, Sami Fethi, EMU, All Right Reserved, McGraw-Hill, 2007, 9. Ed.
5
Operations and Production Management
MGMT 405
Answer set 5
(d)
Run per year
D 4000
7.75
Q 516.4
(e)
TCmin carring cos t or handling cos t setup cos t (
I max
D
309.84
4000
)H
S
($5)
($100) $ 1549
2
Qo
2
516.4
Handling cost =774.5
Setup cost=774.5
If setup cost is $ 25
The economic run quantity Q
I max
2DS
H
(2) (4000) (25)
P
50
258.2 tons
P U
5
50 20
Qo
258.2
( p u)
(50 20) 154.92 tons
p
50
TCmin carring cos t or handling cos t setup cos t (
I max
D
154.84
4000
)H
S
($5)
($25) $ 774.5
2
Qo
2
258.2
Savings would be 1549-774.5=$ 774.5
© 2010/11, Sami Fethi, EMU, All Right Reserved, McGraw-Hill, 2007, 9. Ed.
6
Operations and Production Management
4.
MGMT 405
Answer set 5
A manufacturer of exercise equipment purchases the pulley section of the
equipment from supplier who lists these prices: less than 1000, $5 each; 1000 to
3,999, $ 4.95 each; 4000 to 5999, $ 4.90 each; and 6000 and more $ 4.85.
Ordering costs are $ 50, annual carring costs per unit are 40 percent of purchase
cost, and annual usage is 4900 pulleys. Determine
(a) the common EOQ (the common minimum point)
(b) the total cost if the feasible minimum point is on the lowest price range, that is the
optimal order quantity.
(c) the total cost if the feasible minimum point is in any other price range.
ANS:
Range
Price
0 to 999
$ 5
1000 to 3999
4.95
4000 to 5999
4.90
6000 and more
4.85
(a)
H= 0.40 P
H= 0.40 (5)=2 ;H= 0.40 (4.95)=1.98; H= 0.40 (4.90)=1.96; H= 0.40 (4.85)=1.94
D=4900; S=$ 50
Q5
2DS
2(4900)(50)
494.97 nearly 495 seats
H
2
2 DS
2(4900)(50)
© 2010/11,
McGraw-Hill,
9. Ed.
Q4.95 Sami Fethi,
EMU, All Right Reserved,
497.46
nearly 4982007,
seats
H
1.98
7
Operations and Production Management
MGMT 405
Q4.90
2 DS
H
2(4900)(50)
500 seats
1.96
Q4.85
2 DS
H
2(4900)(50)
503 seats
1.94
Answer set 5
First one is feasible because it is in the range compared to the others.
(b)
TC = Carrying cost + Order cost + Purchase cost
TC 495
495
Q
D
4900
H
S PD
($2)
($50) ($5) (4900) $ 25490
2
Qo
2
495
(c)
TC1000
1000
Q
D
4900
H
S PD
($1.98)
($50) ($4.95) (4900) $ 25490
2
Qo
2
1000
TC 4000
TC 6000
5.
4000
Q
D
4900
H
S PD
($1.96)
($50) ($4.90) (4900) $ 27991
2
Qo
2
4000
6000
Q
D
4900
H
S PD
($1.94)
($50) ($4.85) (4900) $ 29626
2
Qo
2
6000
A newspaper publisher uses roughly 800 feet of baling wire each day to secure
bundles of newspapers while they are being distributed to carriers. The paper is published
Monday through Saturday. Lead time is six working days. The company desires a service
© 2010/11, Sami Fethi, EMU, All Right Reserved, McGraw-Hill, 2007, 9. Ed.
8
Operations and Production Management
MGMT 405
Answer set 5
level of 95% when stock-out risk for various levels of safety stocks are as follows: 1500
feet, 0.10; 1800 feet, 0.05; 2100 feet, 0.02; and 2400 feet, 0.01?
(a) What value of Z is appropriate?
(b) Find the standard deviation of lead time?
(c) What reorder point should be used?
ANS:
(a) What value of Z ias appropriate?
Daily usage=800feet/day
Lead time is 6 days
Safety stock= Zα dLT=1800 at level of 0.05 percent
Risk =1-0.95=0.05 percent
0.05 from z table (lead time), z= 1.64 (page 569, table 12.3)
(b) Find the standard deviation of lead time?
Safety stock = Z αdLT= 1800 at level of 0.05 percent
αdLT=1800/1.64= 1097.561
(c) What reorder point should be used?
ROP= Expected demand in (LT) + ZαdLT =(800)*(6)+1800= 6000 feet
© 2010/11, Sami Fethi, EMU, All Right Reserved, McGraw-Hill, 2007, 9. Ed.
9
Operations and Production Management
MGMT 405
Answer set 5
6. A manager of a construction supply house determined from historical records that
demand for sand during lead time averages 300 units. In addition, the manager
determined that demand during lead time could be described by a normal distribution that
has a mean of 300 units and a standard deviation of 30 units.
(a) Determine the appropriate Z-value whilst risk of stockout 1 percent?
(b) Determine ROP when the risk of stockout is 1 percent during lead time?
(c) Find the safety stock needed to attain a 1 percent risk of stockout during lead time?
(d) Would a stockout risk of 2 percent require more or less safety stock compared to a
1percent risk?
ANS:
(a) Risk =1-0.01=0.99 percent
0.99 from z table (lead time), z= 2.33 (page 569, table 12.3)
(b)
LT=300, αLT=30
ROP= Expected demand in (LT) + ZαdLT =300+(30) (2.33)= nearly 370 units
(c) Safety stock = Z αdLT= 2.33(30)= nearly 70 units
(d)
Ans: IF risk is 2
© 2010/11, Sami Fethi, EMU, All Right Reserved, McGraw-Hill, 2007, 9. Ed.
10
Operations and Production Management
MGMT 405
Answer set 5
Risk =1-0.01=0.98 percent
0.99 from z table (lead time), z= 2.04 (page 569, table 12.3)
LT=300, αLT=30
ROP= Expected demand in (LT) + ZαdLT =300+(30) (2.04)= nearly 361 units
Safety stock = Z αdLT= 2.04(30)= nearly 61.2 units
when risk is 2, z, safety stock and ROP are found smaller compared to the previous one.
7. A computer store sells an item which is supplied by a vendor who handles only that
item. Demand for this item recently changed. The manager wants a probability of at least
96 percent of not having a stockout during lead time. The manager expects demand to
average a dozen units a day and have a standard deviation of 2 units a day. Lead time is
variable averaging four days with standard deviation of one day. Assume normality and
seasonality is not a factor.
(a) Find the appropriate Z value.
(b) What is ROP?
Z= .96, d‾=12 units/day, αd=2units/day, LT=4 days, αLT=1 day
ANS:
(a)
(page 569, table 12.3)
(b)
© 2010/11, Sami Fethi, EMU, All Right Reserved, McGraw-Hill, 2007, 9. Ed.
11
Operations and Production Management
MGMT 405
Answer set 5
2
ROP d L T z L T d2 d LT
ROP 12 * 4 1.75 (4)(4) (144)(1) 70.14
8. Demand for jelly doughnuts on Saturdays at Don’s Doughnut Shoppe is shown in the
following table. If labor, materials, and overhead are estimated to be $ 3.20 per dozen,
doughnuts are sold for $ 4.80 per dozen, and left over doughnuts at the end of each day
are sold the next day at half price,
(a) Determine the shortage and excess costs
(b) Determine the service level
(c) Calculate the stockout risk factor
(d) list the cumulative tables for demand
(e) Compute the optimal number of doughnuts?
Demand
(Dozen)
Relative.Freq.
19
0.01
20
0.05
21
0.12
22
0.18
23
0.13
© 2010/11, Sami Fethi, EMU, All Right Reserved, McGraw-Hill, 2007, 9. Ed.
12
Operations and Production Management
24
0.14
25
0.10
26
0.11
27
0.10
28
0.04
29
0.02
MGMT 405
Answer set 5
ANS:
(a) Ce = Cost per unit- Salvage value per unit
=$ 3.20-2.40= $ 0.80 per dozen
Cs = Revenue per unit-Cost per unit
=$ 4.80-$ 3.20=$ 1.60 per dozen
(b) Service level = Cs/(Cs+Ce) = 1.60/(1.60+0.80)=0.67
(c) Stockout risk = 1.00 – 0.67 = 0.33
(d)
Demand
(Dozen)
Relative Freq. Cumulative Freq.
19
0.01
0.01
20
0.05
0.06
21
0.12
0.18
22
0.18
0.36
23
0.13
0.49
24
0.14
0.63
25
0.10
0.73
© 2010/11, Sami Fethi, EMU, All Right Reserved, McGraw-Hill, 2007, 9. Ed.
13
Operations and Production Management
26
0.11
0.84
27
0.10
0.94
28
0.04
0.98
29
0.02
1.00
MGMT 405
Answer set 5
(e) Since the service level falls between the cumulative probabilities of 0.63 (24) and 0.73
(25), this means that the company should stock 25 dozen doughnuts because 0.67 is
closer to 0.73.
© 2010/11, Sami Fethi, EMU, All Right Reserved, McGraw-Hill, 2007, 9. Ed.
14

