Linear Regression Analysis
advertisement

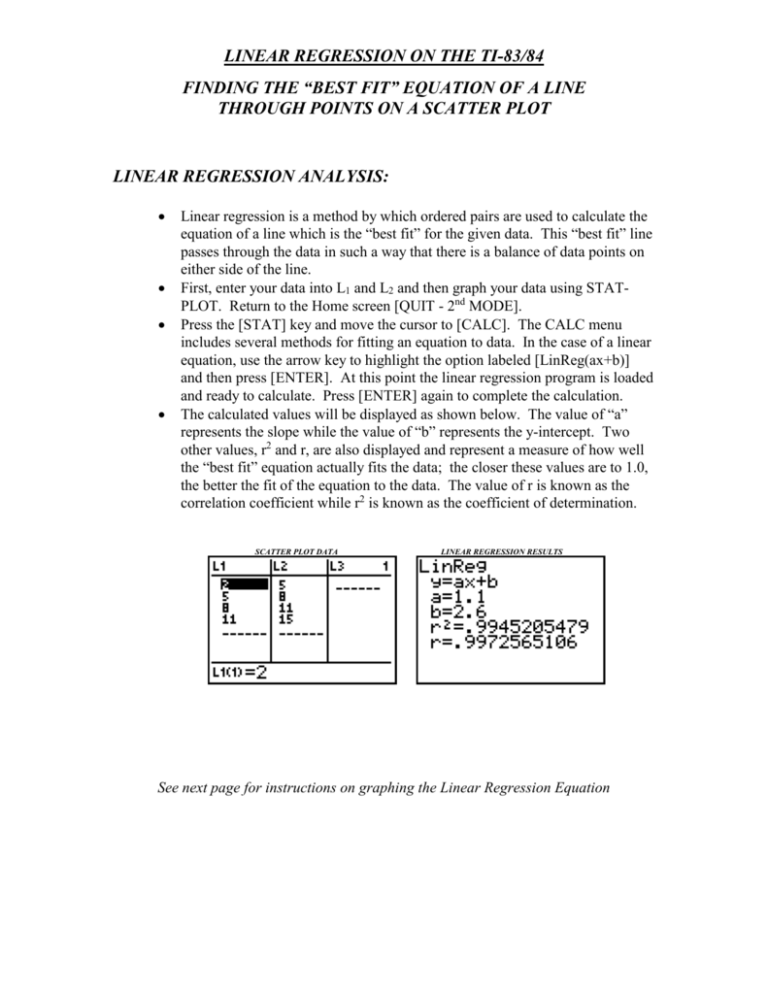
LINEAR REGRESSION ON THE TI-83/84 FINDING THE “BEST FIT” EQUATION OF A LINE THROUGH POINTS ON A SCATTER PLOT LINEAR REGRESSION ANALYSIS: Linear regression is a method by which ordered pairs are used to calculate the equation of a line which is the “best fit” for the given data. This “best fit” line passes through the data in such a way that there is a balance of data points on either side of the line. First, enter your data into L1 and L2 and then graph your data using STATPLOT. Return to the Home screen [QUIT - 2nd MODE]. Press the [STAT] key and move the cursor to [CALC]. The CALC menu includes several methods for fitting an equation to data. In the case of a linear equation, use the arrow key to highlight the option labeled [LinReg(ax+b)] and then press [ENTER]. At this point the linear regression program is loaded and ready to calculate. Press [ENTER] again to complete the calculation. The calculated values will be displayed as shown below. The value of “a” represents the slope while the value of “b” represents the y-intercept. Two other values, r2 and r, are also displayed and represent a measure of how well the “best fit” equation actually fits the data; the closer these values are to 1.0, the better the fit of the equation to the data. The value of r is known as the correlation coefficient while r2 is known as the coefficient of determination. SCATTER PLOT DATA LINEAR REGRESSION RESULTS See next page for instructions on graphing the Linear Regression Equation LINEAR REGRESSION ON THE TI-83/84 FINDING THE “BEST FIT” EQUATION OF A LINE THROUGH POINTS ON A SCATTER PLOT GRAPHING THE LINEAR REGRESSION EQUATION: In order to graph the “best fit” equation along with the scatter plot data, the linear regression equation needs to be copied to the [y=] screen. While this process can be completed manually, it is easier to import the regression analysis results directly into the [y=] screen. Here are two different approaches to accomplish this task: I. Directly from Regression Analysis: Enter your Regression Analysis command as before but with additional information to indicate that you want to complete the regression analysis using data in L1 and L2 and then place the answer in Y1. The complete command will look like: LinReg(ax+b) L1,L2,Y1 , all separated by commas (comma button is located above the number 7) L1 and L2 are located in blue or gold above the numbers 1 and 2 respectively. Use the 2nd key to access these labels. Y1 may be found by pressing the [VARS] key, scrolling to the right to [Y-VARS], selecting option 1 [Function] and then finally selecting Y1 from the available list. II. If you have already completed Regression Analysis: Go to the [y=] screen. The cursor should be located next to Y1=. Press the [VARS] key and then highlight and select [Statistics]. From the Statistic menu, move the cursor over to [EQ] and then select [RegEQ]. When you hit [ENTER], the regression equation will be automatically imported into the [y=] screen. Press the [GRAPH] key to see a graph of both the data and the best fit line. Use [TRACE] or the [CALC] operations to predict other values based on the best fit line. NOTE: L1 and L2 are the default data columns used for regression analysis. If your data is entered into columns labeled something other than L1 and L2, then you must specify the exact names along with your regression command (e.g. LinReg(ax+b) L3,L4,Y1).


