Project 3, Due: December 8
advertisement
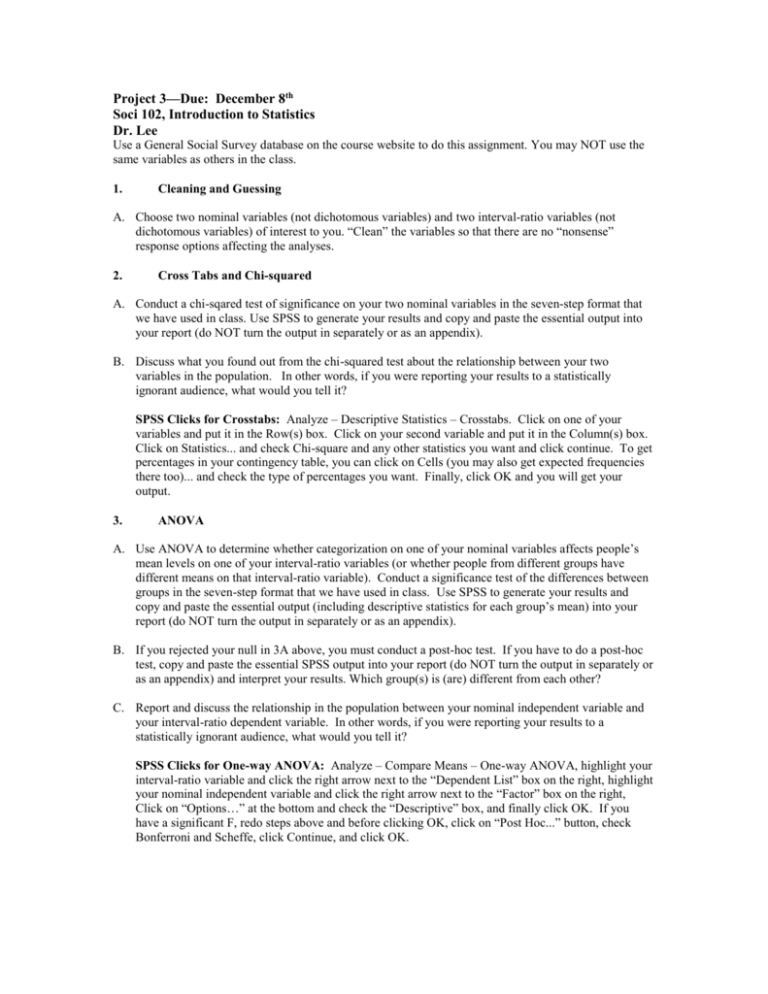
Project 3—Due: December 8th Soci 102, Introduction to Statistics Dr. Lee Use a General Social Survey database on the course website to do this assignment. You may NOT use the same variables as others in the class. 1. Cleaning and Guessing A. Choose two nominal variables (not dichotomous variables) and two interval-ratio variables (not dichotomous variables) of interest to you. “Clean” the variables so that there are no “nonsense” response options affecting the analyses. 2. Cross Tabs and Chi-squared A. Conduct a chi-sqared test of significance on your two nominal variables in the seven-step format that we have used in class. Use SPSS to generate your results and copy and paste the essential output into your report (do NOT turn the output in separately or as an appendix). B. Discuss what you found out from the chi-squared test about the relationship between your two variables in the population. In other words, if you were reporting your results to a statistically ignorant audience, what would you tell it? SPSS Clicks for Crosstabs: Analyze – Descriptive Statistics – Crosstabs. Click on one of your variables and put it in the Row(s) box. Click on your second variable and put it in the Column(s) box. Click on Statistics... and check Chi-square and any other statistics you want and click continue. To get percentages in your contingency table, you can click on Cells (you may also get expected frequencies there too)... and check the type of percentages you want. Finally, click OK and you will get your output. 3. ANOVA A. Use ANOVA to determine whether categorization on one of your nominal variables affects people’s mean levels on one of your interval-ratio variables (or whether people from different groups have different means on that interval-ratio variable). Conduct a significance test of the differences between groups in the seven-step format that we have used in class. Use SPSS to generate your results and copy and paste the essential output (including descriptive statistics for each group’s mean) into your report (do NOT turn the output in separately or as an appendix). B. If you rejected your null in 3A above, you must conduct a post-hoc test. If you have to do a post-hoc test, copy and paste the essential SPSS output into your report (do NOT turn the output in separately or as an appendix) and interpret your results. Which group(s) is (are) different from each other? C. Report and discuss the relationship in the population between your nominal independent variable and your interval-ratio dependent variable. In other words, if you were reporting your results to a statistically ignorant audience, what would you tell it? SPSS Clicks for One-way ANOVA: Analyze – Compare Means – One-way ANOVA, highlight your interval-ratio variable and click the right arrow next to the “Dependent List” box on the right, highlight your nominal independent variable and click the right arrow next to the “Factor” box on the right, Click on “Options…” at the bottom and check the “Descriptive” box, and finally click OK. If you have a significant F, redo steps above and before clicking OK, click on “Post Hoc...” button, check Bonferroni and Scheffe, click Continue, and click OK. 4. Bivariate Regression A. Use bivariate regression to determine whether your two interval-ratio variables are related to each other (or whether as one variable “goes up,”does the other go up or down?). Conduct a significance test of the relationship between the two variables in the seven-step format that we have used in class. Use SPSS to generate your results and copy and paste the essential output into your report (do NOT turn the output in separately or as an appendix). B. Report what your R2 statistic tells you about the relationship between your two interval-ratio variables. C. Discuss what you found out from the bivariate regression about the relationship between your two variables in the population. In other words, if you were reporting your results to a statistically ignorant audience, what would you tell it? SPSS Clicks for Bivariate Regression: Analyze – Regression – Linear, highlight the dependent interval-ratio variable and click the right arrow next to the “Dependent:” box on the right, highlight your independent interval-ratio variable and click the right arrow next to the “Independent(s):” box on the right, and click OK.


