Variation and Sampling
advertisement
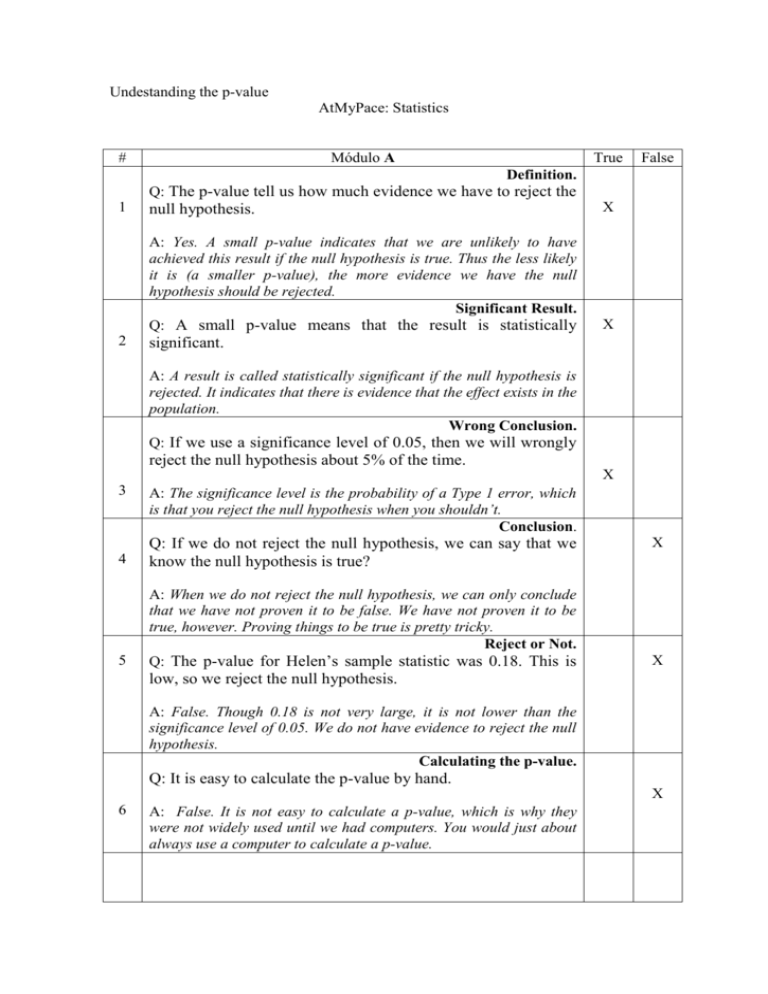
Undestanding the p-value AtMyPace: Statistics # Módulo A True False Definition. Q: The p-value tell us how much evidence we have to reject the 1 2 null hypothesis. X A: Yes. A small p-value indicates that we are unlikely to have achieved this result if the null hypothesis is true. Thus the less likely it is (a smaller p-value), the more evidence we have the null hypothesis should be rejected. Significant Result. Q: A small p-value means that the result is statistically X significant. A: A result is called statistically significant if the null hypothesis is rejected. It indicates that there is evidence that the effect exists in the population. Wrong Conclusion. Q: If we use a significance level of 0.05, then we will wrongly reject the null hypothesis about 5% of the time. X 3 A: The significance level is the probability of a Type 1 error, which is that you reject the null hypothesis when you shouldn’t. Conclusion. 4 Q: If we do not reject the null hypothesis, we can say that we know the null hypothesis is true? 5 A: When we do not reject the null hypothesis, we can only conclude that we have not proven it to be false. We have not proven it to be true, however. Proving things to be true is pretty tricky. Reject or Not. Q: The p-value for Helen’s sample statistic was 0.18. This is X X low, so we reject the null hypothesis. A: False. Though 0.18 is not very large, it is not lower than the significance level of 0.05. We do not have evidence to reject the null hypothesis. Calculating the p-value. Q: It is easy to calculate the p-value by hand. X 6 A: False. It is not easy to calculate a p-value, which is why they were not widely used until we had computers. You would just about always use a computer to calculate a p-value. Significance Level. 7 Q: We should always use a significance or alpha value of 0.05. X A: False. 0.05 is the most usual significance level to use, but other levels such as 0.01 and 0.05 can also be used, depending on how sure we ant to be before we reject the null hypothesis. Choconuttie Example. 8 Q: As the sample mean of 68.7 was lower than 70, it proves that on average all the packets in the population are short of nuts. X A: False. Though the sample mean was lower then 70, this could be due to sampling error or variation – our sample just happened not to be representative of the population. A value much lower than 70 might possibly have been sufficient evidence, but 68.7 is not much lower than 70. Choconuttie Example. Q: Helen took a sample of 20 packets as she could not test the entire population of 400 packets. 9 X A: True. Once the packets were opened they could no longer be sold. A sample was taken to represent all the packets. Choconuttie Example. 10 Q: Helen’s null hypothesis was that the mean weight of peanuts in a packet was 70g or more. A: True. Helen was correct to assume that there are enough nuts, and test to see if there was enough evidence to the contrary. X # Módulo B True Definition. Q: The p-value tells us how much evidence we have to accept False X 1 the null hypothesis. 2 A: No. A small p-value indicates that we are unlikely to have achieved this result if the null hypothesis is true. Thus the less likely it is, the more evidence we have that the null hypothesis should be rejected, not accepted.. Significant Result. Q: A large p-value means that the result is statistically significant. X 3 A: False. A result is called statistically significant if the null hypothesis is rejected. It indicates that there is evidence that the effect exists in the population. Thus a small p-value is associated with a statistically significant result. Wrong Conclusion. Q: If we use a significance level of 0.05, then we will reject the X null hypothesis about 5% of the time. 4 A: No. It depends on the data how often we will reject the null hypothesis. The significance level is the probability of a Type 1 error, which is that we reject the null hypothesis when we shouldn’t. Conclusion. Q: If we reject the null hypothesis, we can say that we have evidence that the null hypothesis is true. X A: False. When we reject the null hypothesis, we have evidence that it is false, not true. Reject or Not. 5 6 Q: The p-value for Helen’s sample statistic was 0.18. This is not low, so we do not reject the null hypothesis. X A: Yes. Though 0.18 is not very large, it is not lower than the significance level of 0.05. We do not have evidence to reject the null hypothesis. Calculating the p-value. Q: P-values are generally calculated by computer packages. X A: Yes. It is not easy to calculate a p-value, which is why they were not widely used until we had computers. You would just about always use a computer to calculate a p-value. 7 Significance Level. Q: The choice of significance level depends on how sure we X want to be before we reject the null hypothesis. A: Yes. 0.05 is the most usual significance level to use, but other levels such as 0.01 and 0.005 can also be used, depending on how sure we want to be before we reject the null hypothesis. Choconuttie Example. 8 Q: As the sample mean of 68.7 was lower than 70, it shows that X on average the packets in the sample are short of nuts. A: Yes. The sample mean was lower then 70, so the packets in the sample definitely had a mean value too low. However this could be a result of sampling error or variation so we cannot assume that the same is true of the population of all packets. Choconuttie Example. Q: The only way Helen could know for sure if the mean weight 9 10 X of nuts in her 400 packets was 70g or more was by testing them all. A: Yes. To be totally sure about the population mean, Helen would need to test the whole population. However she realized how impractical that was, so took a sample instead. Choconuttie Example. Q: Helen’s null hypothesis was that the mean weight of peanuts in a packet was 70g or less. A: False. Helen was correct to assume that there enough nuts, and test to see if there was enough evidence to the contrary. Thus her null hypothesis is that the mean weight of peanuts in a packet was 70g or more. X


