answer key
advertisement
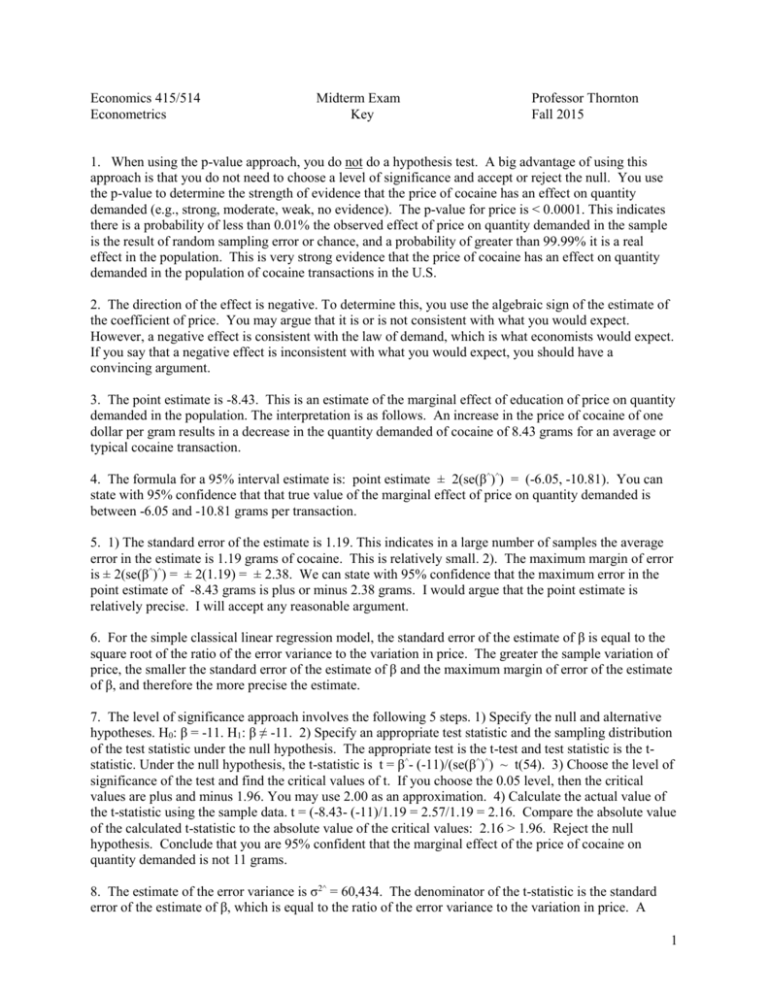
Economics 415/514 Econometrics Midterm Exam Key Professor Thornton Fall 2015 1. When using the p-value approach, you do not do a hypothesis test. A big advantage of using this approach is that you do not need to choose a level of significance and accept or reject the null. You use the p-value to determine the strength of evidence that the price of cocaine has an effect on quantity demanded (e.g., strong, moderate, weak, no evidence). The p-value for price is < 0.0001. This indicates there is a probability of less than 0.01% the observed effect of price on quantity demanded in the sample is the result of random sampling error or chance, and a probability of greater than 99.99% it is a real effect in the population. This is very strong evidence that the price of cocaine has an effect on quantity demanded in the population of cocaine transactions in the U.S. 2. The direction of the effect is negative. To determine this, you use the algebraic sign of the estimate of the coefficient of price. You may argue that it is or is not consistent with what you would expect. However, a negative effect is consistent with the law of demand, which is what economists would expect. If you say that a negative effect is inconsistent with what you would expect, you should have a convincing argument. 3. The point estimate is -8.43. This is an estimate of the marginal effect of education of price on quantity demanded in the population. The interpretation is as follows. An increase in the price of cocaine of one dollar per gram results in a decrease in the quantity demanded of cocaine of 8.43 grams for an average or typical cocaine transaction. 4. The formula for a 95% interval estimate is: point estimate ± 2(se(β^)^) = (-6.05, -10.81). You can state with 95% confidence that that true value of the marginal effect of price on quantity demanded is between -6.05 and -10.81 grams per transaction. 5. 1) The standard error of the estimate is 1.19. This indicates in a large number of samples the average error in the estimate is 1.19 grams of cocaine. This is relatively small. 2). The maximum margin of error is ± 2(se(β^)^) = ± 2(1.19) = ± 2.38. We can state with 95% confidence that the maximum error in the point estimate of -8.43 grams is plus or minus 2.38 grams. I would argue that the point estimate is relatively precise. I will accept any reasonable argument. 6. For the simple classical linear regression model, the standard error of the estimate of β is equal to the square root of the ratio of the error variance to the variation in price. The greater the sample variation of price, the smaller the standard error of the estimate of β and the maximum margin of error of the estimate of β, and therefore the more precise the estimate. 7. The level of significance approach involves the following 5 steps. 1) Specify the null and alternative hypotheses. H0: β = -11. H1: β ≠ -11. 2) Specify an appropriate test statistic and the sampling distribution of the test statistic under the null hypothesis. The appropriate test is the t-test and test statistic is the tstatistic. Under the null hypothesis, the t-statistic is t = β^- (-11)/(se(β^)^) ~ t(54). 3) Choose the level of significance of the test and find the critical values of t. If you choose the 0.05 level, then the critical values are plus and minus 1.96. You may use 2.00 as an approximation. 4) Calculate the actual value of the t-statistic using the sample data. t = (-8.43- (-11)/1.19 = 2.57/1.19 = 2.16. Compare the absolute value of the calculated t-statistic to the absolute value of the critical values: 2.16 > 1.96. Reject the null hypothesis. Conclude that you are 95% confident that the marginal effect of the price of cocaine on quantity demanded is not 11 grams. 8. The estimate of the error variance is σ2^ = 60,434. The denominator of the t-statistic is the standard error of the estimate of β, which is equal to the ratio of the error variance to the variation in price. A 1 larger error variance (more unexplained variation in the quantity demanded of cocaine) would result in a larger standard error and a smaller t-statistic. If the error variance was twice as large, then the calculated t-statistic would be reduced by 50%. As a result, you would be less likely to reject and more likely to accept the null hypothesis. 9. The R2 statistic of 0.48 indicates that 48% of the variation in the quantity demanded of cocaine is explained by variation in price. The model does not fit the data very well, since 52% of the variation in quantity demanded is explained by factors other than price. 10. No. The objective of the study is explanation, not prediction. We are interested in analyzing if the price of cocaine has a causal effect on the quantity demanded, and this has nothing to do per se with how well the model fits the sample data. 11. I will accept any tenable argument. Here are the arguments I would make. a) Individuals are willing to pay a higher price for a higher quality product. Also, individuals prefer a higher quality product to a lower quality product, so quantity demanded is higher for a higher quality product than a lower quality product. As a result, one can argue that the quality of cocaine has an effect on quantity demanded and is correlated with price, and therefore satisfies the requirements of a confounding variable. If qual is a confounding variable, the error term will be correlated with price. Why? Transactions with higher quality cocaine will have a larger quantity demanded, and therefore larger errors. They will also have higher prices. As a result, the error term will be positively correlated with price. For the OLS estimator to produce an unbiased estimate, the error term cannot be correlated with the explanatory variable, so the OLS is estimate is biased. Since the error term is positively correlated with price, the OLS estimate of the effect of price on quantity demanded will be biased upward; that is it will be systematically too high. This is because it will not only include the effect of the price of cocaine on quantity demanded, it will also include the effect of the quality of cocaine. b) Economic theory suggests that not only does the price of a good affect quantity demanded, but the quantity demanded of a good also affects price. This is because the greater the quantity demanded of a good, the higher the price it can command. As a result, one can argue that reverse causation exists from quantity demanded to price. The will cause the error term to be correlated with price. Why? Transactions with higher quality cocaine will have larger errors and larger quantities demanded. But transactions with larger quantities demanded will have higher prices. For the OLS estimator to produce an unbiased estimate, the error term cannot be correlated with the explanatory variable, so the OLS is estimate is biased. Since the error term is positively correlated with price, the OLS estimate of the effect of price on quantity demanded will be biased upward; that is it will be systematically too high. This is because it will not only include the effect of the price of cocaine on quantity demanded, it will also include the effect of quantity demanded on price. 2


