on ICCs
advertisement

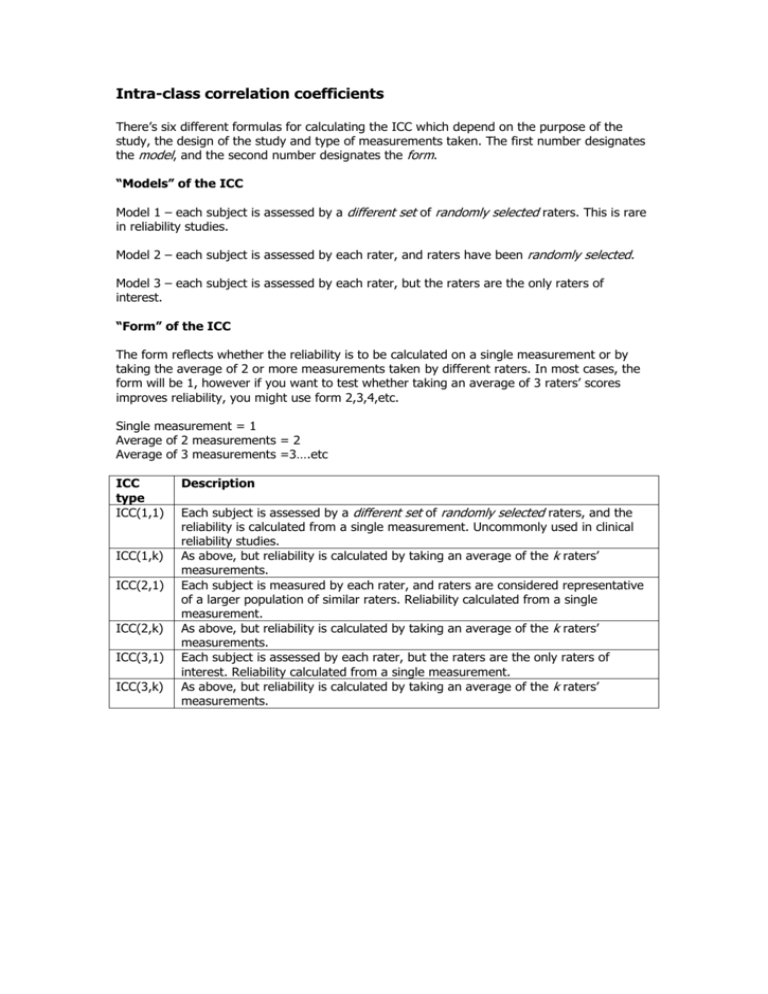
Intra-class correlation coefficients There’s six different formulas for calculating the ICC which depend on the purpose of the study, the design of the study and type of measurements taken. The first number designates the model, and the second number designates the form. “Models” of the ICC Model 1 – each subject is assessed by a different set of randomly selected raters. This is rare in reliability studies. Model 2 – each subject is assessed by each rater, and raters have been randomly selected. Model 3 – each subject is assessed by each rater, but the raters are the only raters of interest. “Form” of the ICC The form reflects whether the reliability is to be calculated on a single measurement or by taking the average of 2 or more measurements taken by different raters. In most cases, the form will be 1, however if you want to test whether taking an average of 3 raters’ scores improves reliability, you might use form 2,3,4,etc. Single measurement = 1 Average of 2 measurements = 2 Average of 3 measurements =3….etc ICC type ICC(1,1) ICC(1,k) ICC(2,1) ICC(2,k) ICC(3,1) ICC(3,k) Description Each subject is assessed by a different set of randomly selected raters, and the reliability is calculated from a single measurement. Uncommonly used in clinical reliability studies. As above, but reliability is calculated by taking an average of the k raters’ measurements. Each subject is measured by each rater, and raters are considered representative of a larger population of similar raters. Reliability calculated from a single measurement. As above, but reliability is calculated by taking an average of the k raters’ measurements. Each subject is assessed by each rater, but the raters are the only raters of interest. Reliability calculated from a single measurement. As above, but reliability is calculated by taking an average of the k raters’ measurements. How to do ICCs in SPSS 1. Select Analyse/Scale/Reliability analysis: 2. Select your two columns of data and click on Statistics: 3. Click the intraclass correlation coefficient checkbox. 4. You have two options to choose from here: Model: Two-way mixed OR Two-way random OR one-way random Type: Consistency OR Agreement This is because SPSS doesn’t stick to the standard ICC nomenclature. Here’s how to define the ICC models: ICC model Model 1 Model 2 Model 3 What SPSS calls it One-way random Two-way random Two-way mixed The type gives you the option of working out whether the error involved in the measurement is systematic or not (ie: are the measurements “offset” between trials or between raters. If this is considered important, you select “Absolute agreement”, otherwise leave the default as “Consistency”. If you are also using paired t-tests to check for systematic differences between trials, you needn’t worry about selecting “Absolute agreement” as you will have already worked out if there are systematic differences. 5. The output is a typically ugly SPSS number that looks like this: Two lots of ICC data are produced: one for the single measure, and one for the average measure. You decide which one to document based on the “form” of the ICC (ie: whether you take a single measure or whether you average the measurements from multiple raters). Though it may be tempting to document the average measure (as it will be a better ICC), this is cheating unless you have decided a priori to use an average. In most cases, you will be using a single measure anyway. Summary ICC type ICC(1,1) ICC(1,k) ICC(2,1) ICC(2,k) ICC(3,1) ICC(3,k) What SPSS calls it One-way random, single measure One-way random, average measure Two-way random, single measure Two-way random, average measure Two-way mixed, single measure Two-way mixed, average measure


