Regression Analysis Practice Test: Multiple Choice Questions
advertisement
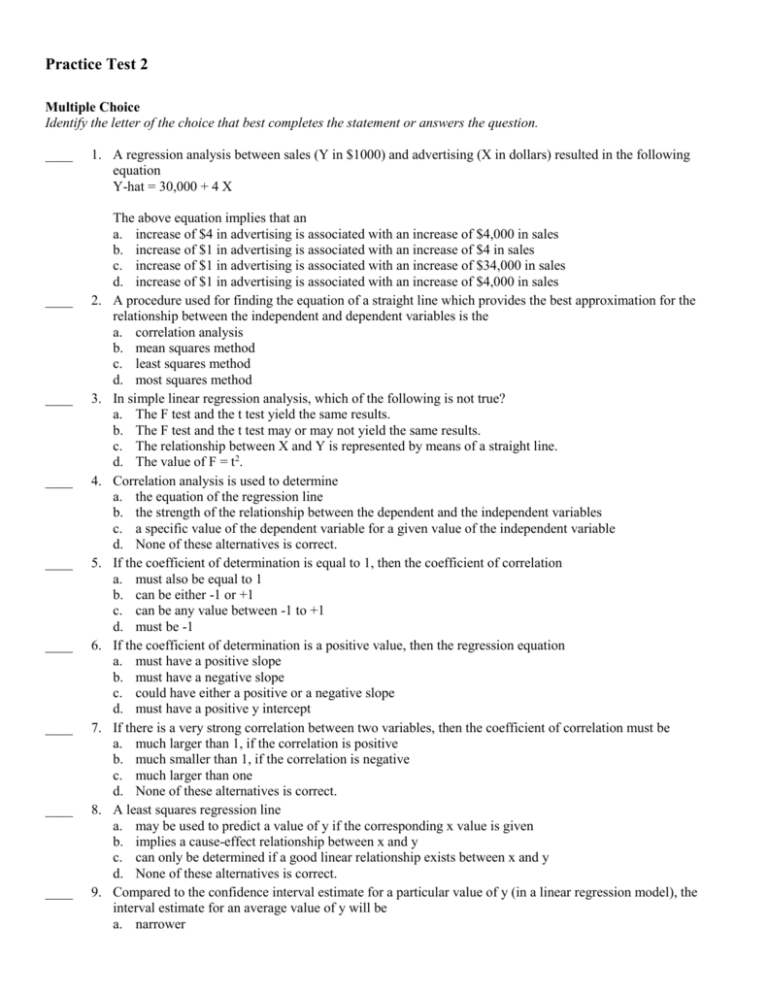
Practice Test 2 Multiple Choice Identify the letter of the choice that best completes the statement or answers the question. ____ 1. A regression analysis between sales (Y in $1000) and advertising (X in dollars) resulted in the following equation Y-hat = 30,000 + 4 X ____ 2. ____ 3. ____ 4. ____ 5. ____ 6. ____ 7. ____ 8. ____ 9. The above equation implies that an a. increase of $4 in advertising is associated with an increase of $4,000 in sales b. increase of $1 in advertising is associated with an increase of $4 in sales c. increase of $1 in advertising is associated with an increase of $34,000 in sales d. increase of $1 in advertising is associated with an increase of $4,000 in sales A procedure used for finding the equation of a straight line which provides the best approximation for the relationship between the independent and dependent variables is the a. correlation analysis b. mean squares method c. least squares method d. most squares method In simple linear regression analysis, which of the following is not true? a. The F test and the t test yield the same results. b. The F test and the t test may or may not yield the same results. c. The relationship between X and Y is represented by means of a straight line. d. The value of F = t2. Correlation analysis is used to determine a. the equation of the regression line b. the strength of the relationship between the dependent and the independent variables c. a specific value of the dependent variable for a given value of the independent variable d. None of these alternatives is correct. If the coefficient of determination is equal to 1, then the coefficient of correlation a. must also be equal to 1 b. can be either -1 or +1 c. can be any value between -1 to +1 d. must be -1 If the coefficient of determination is a positive value, then the regression equation a. must have a positive slope b. must have a negative slope c. could have either a positive or a negative slope d. must have a positive y intercept If there is a very strong correlation between two variables, then the coefficient of correlation must be a. much larger than 1, if the correlation is positive b. much smaller than 1, if the correlation is negative c. much larger than one d. None of these alternatives is correct. A least squares regression line a. may be used to predict a value of y if the corresponding x value is given b. implies a cause-effect relationship between x and y c. can only be determined if a good linear relationship exists between x and y d. None of these alternatives is correct. Compared to the confidence interval estimate for a particular value of y (in a linear regression model), the interval estimate for an average value of y will be a. narrower b. wider c. the same d. None of these alternatives is correct. ____ 10. If the coefficient of correlation is 0.4, the percentage of variation in the dependent variable explained by the variation in the independent variable a. is 40% b. is 16%. c. is 4% d. can be any positive value ____ 11. In regression analysis if the dependent variable is measured in dollars, the independent variable a. must also be in dollars b. must be in some units of currency c. can be any units d. can not be in dollars ____ 12. A regression analysis between demand (Y in 1000 units) and price (X in dollars) resulted in the following equation Y-hat = 9 - 3X The above equation implies that if the price is increased by $1, the demand is expected to a. increase by 6 units b. decrease by 3 units c. decrease by 6,000 units d. decrease by 3,000 units Exhibit 14-1 The following information regarding a dependent variable (Y) and an independent variable (X) is provided. Y 4 3 4 6 8 X 2 1 4 3 5 SSE = 6 SST = 16 ____ 13. Refer to Exhibit 14-1. The least squares estimate of the slope is a. 1 b. 2 c. 3 d. 4 Exhibit 14-2 You are given the following information about y and x. y Dependent Variable 5 4 3 2 1 x Independent Variable 1 2 3 4 5 ____ 14. Refer to Exhibit 14-2. The least squares estimate of b0 equals a. 1 b. -1 c. 6 d. 5 Exhibit 14-4 Regression analysis was applied between sales data (in $1,000s) and advertising data (in $100s) and the following information was obtained. y-hat = 12 + 1.8 x n = 17 SSR = 225 SSE = 75 Sb1 = 0.2683 ____ 15. Refer to Exhibit 14-4. The F statistic computed from the above data is a. 3 b. 45 c. 48 d. 50 Exhibit 14-8 The following information regarding a dependent variable Y and an independent variable X is provided X = 16 Y = 24 XY = 72 n=4 X2 = 84 Y2 = 174 ____ 16. Refer to Exhibit 14-8. The slope of the regression equation is a. 10.8 b. -10.8 c. -1.2 d. 1.2 ____ 17. Refer to Exhibit 14-8. The coefficient of determination is a. 1.00 b. 0.96 c. 0.98 d. 0.77 Exhibit 14-9 A regression and correlation analysis resulted in the following information regarding a dependent variable (y) and an independent variable (x). n = 10 x = 55 y = 55 x2 = 385 y2 = 385 xy = 220 ____ 18. Refer to Exhibit 14-9. The sample correlation coefficient equals a. 0 b. -1 c. +1 d. -0.5 ____ 19. A regression model involved 5 independent variables and 126 observations. The critical value of t for testing the significance of each of the independent variable's coefficients will have a. 131 degrees of freedom b. 125 degrees of freedom c. 130 degrees of freedom d. 4 degrees of freedom ____ 20. A variable that takes on the values of 0 or 1 and is used to incorporate the effect of qualitative variables in a regression model is called a. an interaction b. a constant variable c. a dummy variable d. None of these alternatives is correct. Exhibit 15-3 In a regression model involving 30 observations, the following estimated regression equation was obtained: Y-hat = 17 + 4X1 - 3X2 + 8X3 + 8X4 For this model SSR = 700 and SSE = 100. ____ 21. Refer to Exhibit 15-3. The computed F statistic for testing the significance of the above model is a. 43.75 b. 0.875 c. 50.19 d. 7.00 Exhibit 15-5 Below you are given a partial Minitab output based on a sample of 25 observations. Coefficient Constant X1 X2 X3 145.321 25.625 -5.720 0.823 Standard Error 48.682 9.150 3.575 0.183 ____ 22. Refer to Exhibit 15-5. Carry out the test of significance for the parameter 1 at the 5% level. The null hypothesis should be a. rejected b. not rejected c. revised d. None of these alternatives is correct. Exhibit 15-6 Below you are given a partial computer output based on a sample of 16 observations. Coefficient Constant X1 X2 12.924 -3.682 45.216 Standard Error 4.425 2.630 12.560 Analysis of Variance Source of Variation Regression Error Degrees of Freedom Sum of Squares Mean Square 4,853 2,426.5 485.3 F ____ 23. Refer to Exhibit 15-6. The sum of squares due to error (SSE) equals a. 37.33 b. 485.3 c. 4,853 d. 6,308.9 ____ 24. A regression model in which more than one independent variable is used to predict the dependent variable is called a. a simple linear regression model b. a multiple regression model c. an independent model d. None of these alternatives is correct. Exhibit 15-7 A regression model involving 4 independent variables and a sample of 15 periods resulted in the following sum of squares. SSR = 165 SSE = 60 ____ 25. Refer to Exhibit 15-7. The coefficient of determination is a. 0.3636 b. 0.7333 c. 0.275 d. 0.5 ____ 26. A regression analysis involved 6 independent variables and 27 observations. The critical value of t for testing the significance of each of the independent variable's coefficients will have a. 27 degrees of freedom b. 26 degrees of freedom c. 21 degrees of freedom d. 20 degrees of freedom ____ 27. The time series component that reflects variability due to natural disasters is called a. a trend b. seasonal c. cyclical d. irregular ____ 28. Below you are given the first two values of a time series. You are also given the first two values of the exponential smoothing forecast. Time Period (t) 1 2 Time Series Value ( Y t ) 18 22 Exponential Smoothing Forecast ( F t) 18 18 If the smoothing constant equals .3, then the exponential smoothing forecast for time period three is a. 18 b. 19.2 c. 20 d. 40 Exhibit 18-1 Below you are given the first five values of a quarterly time series. The multiplicative model is appropriate and a four-quarter moving average will be used. Year 1 Quarter 1 2 3 4 1 2 Time Series Value Y t 36 24 16 20 44 ____ 29. Refer to Exhibit 18-1. An estimate of the seasonal-irregular component for Quarter 3 of Year 1 is a. .64 b. 1.5625 c. 5.333 d. 30 Exhibit 18-3 Consider the following time series. Year (t) 1 2 3 4 5 Yi 7 5 4 2 1 ____ 30. Refer to Exhibit 18-3. In which time period does the value of Yi reach zero? a. 0.000 b. 0.181 c. 5.53 d. 4.21 Practice Test 2 Answer Section MULTIPLE CHOICE 1. 2. 3. 4. 5. 6. 7. 8. 9. 10. 11. 12. 13. 14. 15. 16. 17. 18. 19. 20. 21. 22. 23. 24. 25. 26. 27. 28. 29. 30. D C B B B C D A A B C D A C B C B B C C A A D B B D D B A C


