homework 4
advertisement
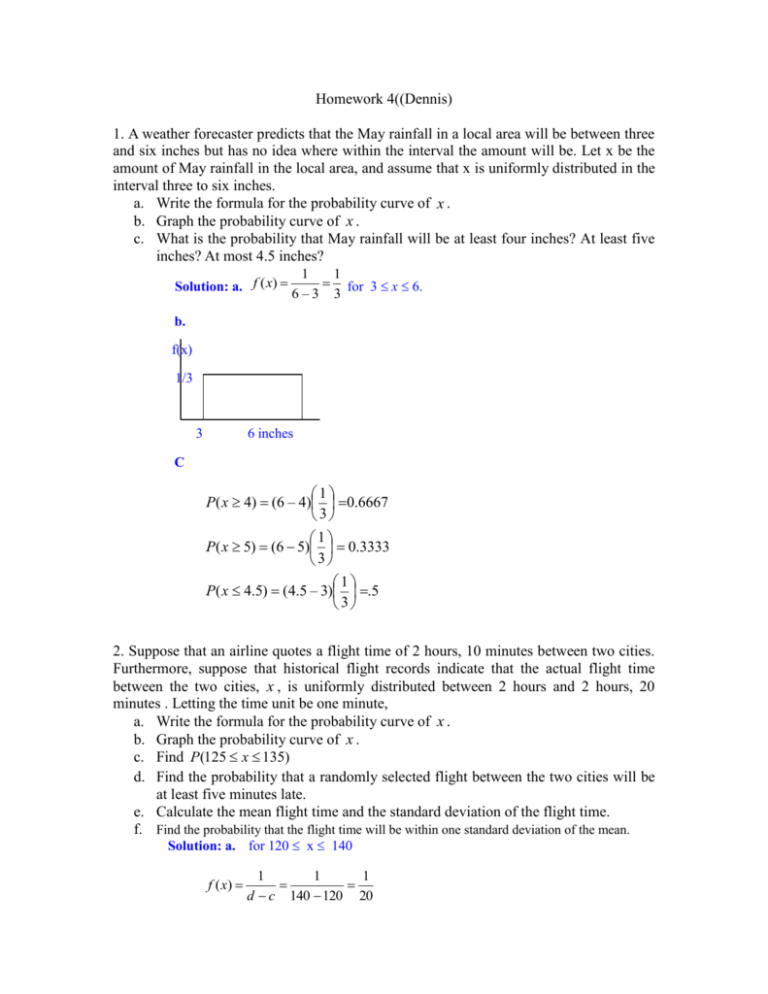
Homework 4((Dennis) 1. A weather forecaster predicts that the May rainfall in a local area will be between three and six inches but has no idea where within the interval the amount will be. Let x be the amount of May rainfall in the local area, and assume that x is uniformly distributed in the interval three to six inches. a. Write the formula for the probability curve of x . b. Graph the probability curve of x . c. What is the probability that May rainfall will be at least four inches? At least five inches? At most 4.5 inches? Solution: a. f ( x) 1 1 for 3 x 6. 6–3 3 b. f(x) 1/3 3 6 inches C 1 P( x 4) (6 – 4) 0.6667 3 1 P( x 5) (6 5) 0.3333 3 1 P( x 4.5) (4.5 – 3) .5 3 2. Suppose that an airline quotes a flight time of 2 hours, 10 minutes between two cities. Furthermore, suppose that historical flight records indicate that the actual flight time between the two cities, x , is uniformly distributed between 2 hours and 2 hours, 20 minutes . Letting the time unit be one minute, a. Write the formula for the probability curve of x . b. Graph the probability curve of x . c. Find P(125 x 135) d. Find the probability that a randomly selected flight between the two cities will be at least five minutes late. e. Calculate the mean flight time and the standard deviation of the flight time. f. Find the probability that the flight time will be within one standard deviation of the mean. Solution: a. for 120 x 140 f ( x) 1 1 1 d c 140 120 20 b. f(x) 1/20 120 140 min c. P(125 x 135) = 10 (1/20) = .5 d. P(x 135) = 5 (1/20) = .25 e. f. c d 120 140 130 2 2 d c 140 120 x 5.7735 12 12 x x x 130 5.7735 124.2265 x x 130 5.7735 135.7735 P(124.2265 x 135.7735) (135.7735 124.2265) x 1 .57735 20 3. Two students take a college entrance exam known to have a normal distribution of scores. The students receive raw scores of 63 and 93, which correspond to z scores (often called the standardized scores) of 1 and 1.5, respectively. Find the mean and standard deviation of the distribution of raw exam scores. Solution: x– 63 – 93 – z , –1 , 1.5 Solve the two equations for the two unknowns: = 75, = 12 4. If the random variable z has a standard normal distribution, sketch and find eachof the following probabilities: a. P(0 z 1.5) b. P ( z 1) c. P(2.5 z 0.5) d. P ( z 2) 5. Suppose that the random variable z has a standard normal distribution. Sketch each of the following z points, and use the normal table to find each z point. a. z0.01 b. z0.1 c. z0.05 d. z0.02 6. Suppose the random variable x is normally distributed with mean 1000 and standard deviation 100 . Sketch and find each of the following probabilities: a. P(1000 x 1200) b . P ( x 700) 7. Suppose the random variable x ~ N (500,10000) . Use the normal table to find the needed value k. In each case, draw a sketch. a. P( x k ) 0.025 c. P(x<k)=0.025 b. P( x k ) 0.985 d. p(x>k)= 0.9772 8 Weekly demand at a grocery sore for a brand of breakfast cereal is normally distributed with a mean of 800 boxes and a standard deviation of 75 boxes. a. What is the probability that weekly demand is (1) 959 boxes or less? (2) More than 1004 boxes? (3) Less than 650 boxes or greater than 950 boxes? b. The store orders cereal from a distributor weekly. How many boxes should the store order for a week to have only a 2.5 percent chance of running short of this brand of cereal during the week? Solution: a.(1) P(x 959) = P(z 2.12) = .9830 (2) P(x > 1004) = P(z > 2.72) = 1 – .9967 = .0033 (3) P(x < 650) + P(x > 950) = P(z < –2) + P(z > 2) = .0228 + (1 – .9772) = .0456 b. P(x > k) = 0.025 According to the Standard Normal Table zk 1.96 k 800 1.96 75 k = 947 boxes of cereal
