STATISTICS
advertisement
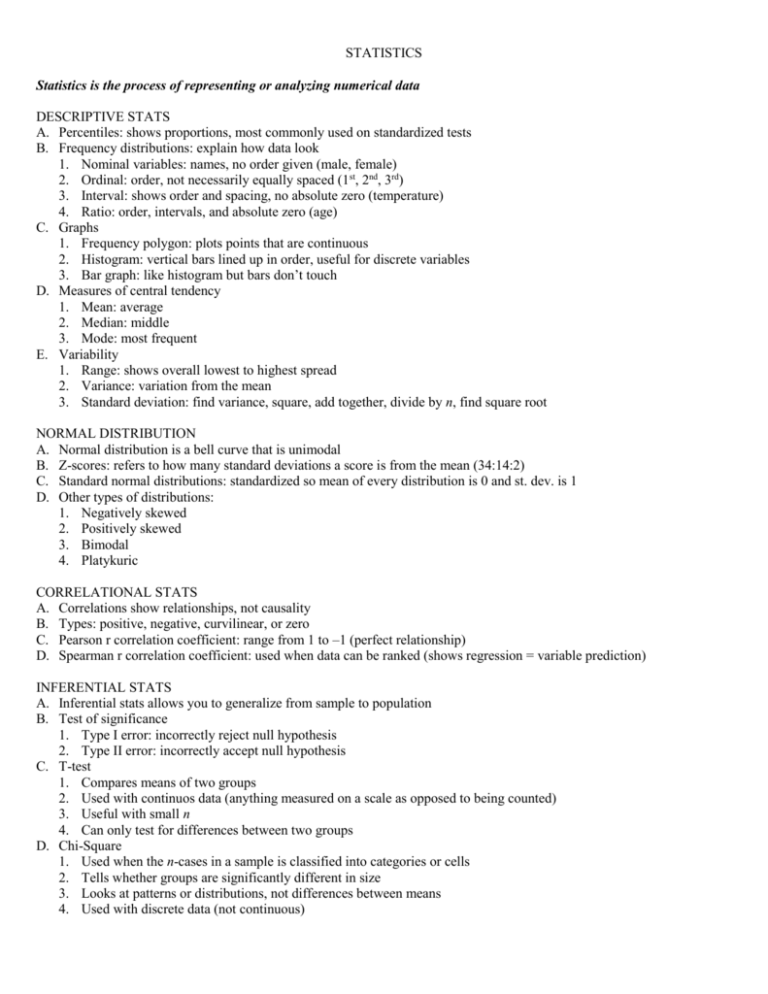
STATISTICS Statistics is the process of representing or analyzing numerical data DESCRIPTIVE STATS A. Percentiles: shows proportions, most commonly used on standardized tests B. Frequency distributions: explain how data look 1. Nominal variables: names, no order given (male, female) 2. Ordinal: order, not necessarily equally spaced (1st, 2nd, 3rd) 3. Interval: shows order and spacing, no absolute zero (temperature) 4. Ratio: order, intervals, and absolute zero (age) C. Graphs 1. Frequency polygon: plots points that are continuous 2. Histogram: vertical bars lined up in order, useful for discrete variables 3. Bar graph: like histogram but bars don’t touch D. Measures of central tendency 1. Mean: average 2. Median: middle 3. Mode: most frequent E. Variability 1. Range: shows overall lowest to highest spread 2. Variance: variation from the mean 3. Standard deviation: find variance, square, add together, divide by n, find square root NORMAL DISTRIBUTION A. Normal distribution is a bell curve that is unimodal B. Z-scores: refers to how many standard deviations a score is from the mean (34:14:2) C. Standard normal distributions: standardized so mean of every distribution is 0 and st. dev. is 1 D. Other types of distributions: 1. Negatively skewed 2. Positively skewed 3. Bimodal 4. Platykuric CORRELATIONAL STATS A. Correlations show relationships, not causality B. Types: positive, negative, curvilinear, or zero C. Pearson r correlation coefficient: range from 1 to –1 (perfect relationship) D. Spearman r correlation coefficient: used when data can be ranked (shows regression = variable prediction) INFERENTIAL STATS A. Inferential stats allows you to generalize from sample to population B. Test of significance 1. Type I error: incorrectly reject null hypothesis 2. Type II error: incorrectly accept null hypothesis C. T-test 1. Compares means of two groups 2. Used with continuos data (anything measured on a scale as opposed to being counted) 3. Useful with small n 4. Can only test for differences between two groups D. Chi-Square 1. Used when the n-cases in a sample is classified into categories or cells 2. Tells whether groups are significantly different in size 3. Looks at patterns or distributions, not differences between means 4. Used with discrete data (not continuous) E. Analysis of Variance (ANOVA) 1. Analyses differences among means of continuous variables 2. More flexible than t-test because it can analyze more than two groups 3. One-way ANOVA: tests whether means on one dep. Variable are different across groups (depression) 4. Two-way ANOVA: can test effects of two independent variables at one (treatment outcomes) F. Factorial analysis of variance 1. Used when there’s more than one independent variable 2. Can separate effects of different levels of different variables 3. Can isolate main effects and interaction effects 4. Example 2 x 2 design G. Analysis of Covariance (ANCOVA) 1. test whether at least two groups covary 2. Can adjust for pre-existing differences between groups H. Linear Regression 1. Use correlation coefficients to predict one variable from another 2. Correlations measure linear relationship between two variables, but don’t describe relationship 3. Linear regression is when regression line on graph best fits data 4. Uses correlational data to make predictions based on best fit line with least-squares method CREATING MEASURES A. Reliability: how stable a measure is 1. Test-retest reliability: same person tested more than once 2. Split-half reliability: comparing persons performance on two halves of test (odd vs even) a. Reveals internal consistency of a test b. Item analysis increases internal consistency B. Validity: how well the test measures a construct 1. Internal validity: extent to which items in a measure “hang together” and test same thing 2. External validity: extent to which test measures what it intends to measure a. Concurrent validity: scores on measure positively correlate with others known to measure construct b. Construct validity: whether test taps construct being measured c. Content validity: whether test content covers good sample of construct and not only part of it d. Face validity: whether test looks like it measures to construct


