Error Bounds for Linear Models and Reasonable Predictions
advertisement
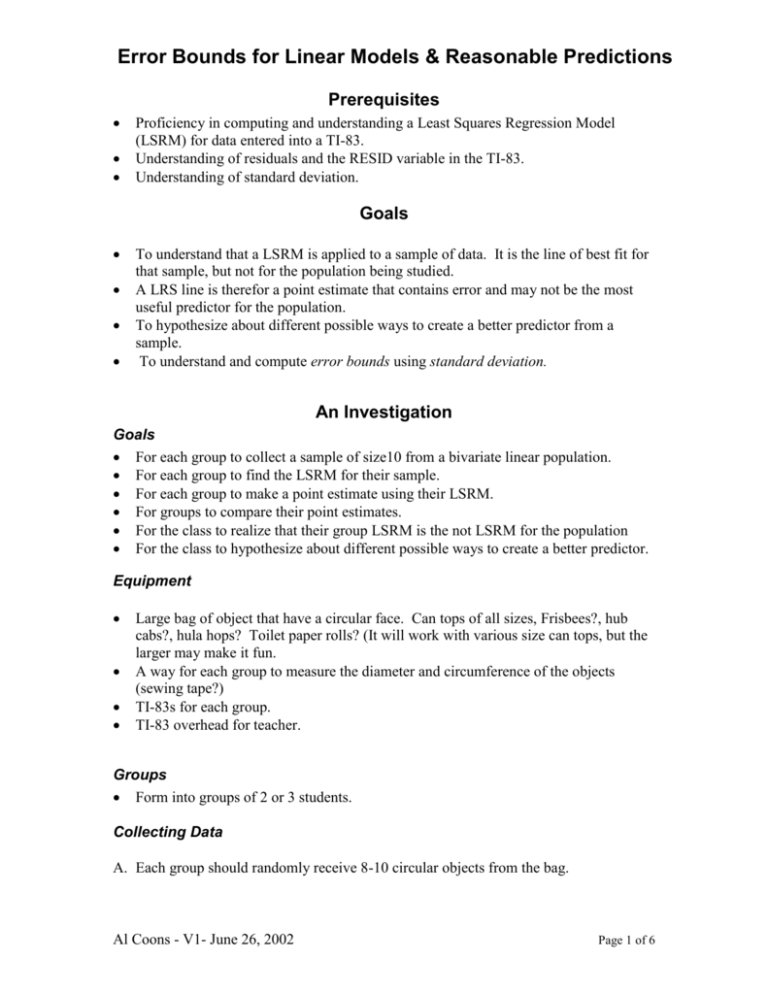
Error Bounds for Linear Models & Reasonable Predictions Prerequisites Proficiency in computing and understanding a Least Squares Regression Model (LSRM) for data entered into a TI-83. Understanding of residuals and the RESID variable in the TI-83. Understanding of standard deviation. Goals To understand that a LSRM is applied to a sample of data. It is the line of best fit for that sample, but not for the population being studied. A LRS line is therefor a point estimate that contains error and may not be the most useful predictor for the population. To hypothesize about different possible ways to create a better predictor from a sample. To understand and compute error bounds using standard deviation. An Investigation Goals For each group to collect a sample of size10 from a bivariate linear population. For each group to find the LSRM for their sample. For each group to make a point estimate using their LSRM. For groups to compare their point estimates. For the class to realize that their group LSRM is the not LSRM for the population For the class to hypothesize about different possible ways to create a better predictor. Equipment Large bag of object that have a circular face. Can tops of all sizes, Frisbees?, hub cabs?, hula hops? Toilet paper rolls? (It will work with various size can tops, but the larger may make it fun. A way for each group to measure the diameter and circumference of the objects (sewing tape?) TI-83s for each group. TI-83 overhead for teacher. Groups Form into groups of 2 or 3 students. Collecting Data A. Each group should randomly receive 8-10 circular objects from the bag. Al Coons - V1- June 26, 2002 Page 1 of 6 Error Bounds for Linear Models & Reasonable Predictions B. Using the same unit of measure, each group should measure the diameter and circumference of each object and record the data below: Item Number Object Description Diameter Circumference 1 2 3 4 5 6 7 8 9 10 C. Add your data carefully to the rest of the classes data in your teacher's TI-83. The goal here is to make on large list of all the data representing the population. Your teacher will use this data to make an important point later. Determine the LSRM Record a rough copy of the scatter plot for your sample of 8-10 objects. Include a picture and the equation of the LSRM. Al Coons - V1- June 26, 2002 Page 2 of 6 Error Bounds for Linear Models & Reasonable Predictions Making A Prediction from Your Sample A. What circumference does your model predict for a diameter of 4.3 inches? Circumference of __________ inches for a diameter of 4.3 inches. B. Record each groups' prediction (including your group) in the chart below: Group Number Circumference (inches) for Diameter = 4.3 inches 1 2 3 4 5 6 7 8 9 10 C. In a sentence or two, explain why each group determined a different prediction. D. In a true experiment, you will only have the data from your sample, but you are trying to predict the circumference for diameter of 4.3 for the ____________________. E. You have created a point estimate for the predicted circumference for a diameter or 4.3 inches for the population. A point estimate is another term for an estimate that is a single number. Given the results in step B, do you think a point estimate or some other estimate is more sensible? What would that new type of estimate be? ____________________________. Al Coons - V1- June 26, 2002 Page 3 of 6 Error Bounds for Linear Models & Reasonable Predictions F. If you suggested creating some sort of interval estimate for your prediction in the previous part you are correct. Look back at the scatter plot of your data. List 3 or 4 different ways you might use the residuals of your LSRM to create prediction intervals using just your data and residuals. Briefly describe your methods below: G. When your teacher instructs you to, share your ideas with the class. Al Coons - V1- June 26, 2002 Page 4 of 6 Error Bounds for Linear Models & Reasonable Predictions H. Various Methods: Most likely your class thought of some of the ideas described below: "The method [you] used to create an interval estimate involved a number that was added to and subtracted from [your point estimate] predicted by [your] least squares line. There were different choices you [made] about how much to add and subtract. As you might expect, statisticians have objective ways to produce these intervals. We will not consider those methods in this course, but we will suggest other ways that provide useful information. One way to create an interval is to add and subtract the residual that is largest in magnitude. However, in most cases an interval created in this way will be unnecessarily large and therefor not particularly useful to a person using the model to make decisions. Another way to create an interval is to add and subtract the average value of the residual. But the average residual value will always be zero, since the positive residuals balance the negative ones. To avoid this cancellation, you can take the absolute value of each residual and then calculate the average. An interval can then be created with this average absolute residual by adding and subtracting form the y-value produced by the least square line.1 Error Bounds A. Using Standard Deviation of the Residuals: "Another option would be to use the standard deviation of the residuals as the number that is added to and subtracted from the y-value predicted by the least squares line. The standard deviation of the set of residuals is a number that measures the spread of the residuals about their average. When a least squares line is fit to a linear data set, approximately 95% of the data will fall within an interval of two standard deviations on either side of the average of the residuals, which is always zero. Thus you will find approximately 95% of the data will fall within an interval of two standard deviation on either side of the least squares line."2 B. Compute the standard deviation of your residuals and record it below. Reminder: to display stdDev(L RESID) use LIST/MATH/stdDev( standard Deviation of the Residuals of your sample: Al Coons - V1- June 26, 2002 Page 5 of 6 Error Bounds for Linear Models & Reasonable Predictions C. Create a picture for your data similar to the one shown below. I contains the sample data, the LSRM and the two standard deviation error bounds. Your results will be different. There are many ways to make this happen on the calculator. On method is shown to the right. D. About what percent of your data do you expect your error bounds to capture? E. What percent of your data did your error bounds capture? Compare this with the other groups in the class. F. Now that you have errors bounds, use your calculator to generate an interval estimate for the circumference your model predicts for a diameter of 4.3 inches: G. Compare this estimate with the other members in the class. H. Compare this estimate with the data for the entire population. 1 Contemporary Precalculus through Applications. 2nd edition. North Carolina School of Science and Mathematics. Everyday Learning. Chicago. 2000. Page 50 2 ibid. Al Coons - V1- June 26, 2002 Page 6 of 6


