Comparing Two Population Parameters
advertisement

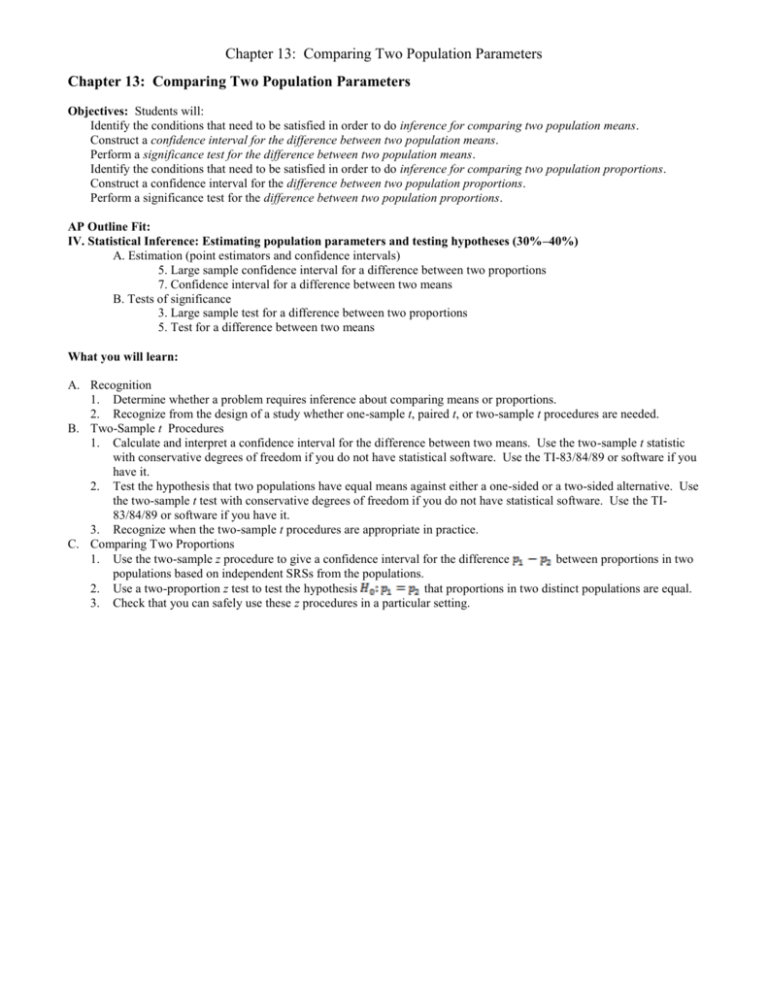
Chapter 13: Comparing Two Population Parameters Chapter 13: Comparing Two Population Parameters Objectives: Students will: Identify the conditions that need to be satisfied in order to do inference for comparing two population means. Construct a confidence interval for the difference between two population means. Perform a significance test for the difference between two population means. Identify the conditions that need to be satisfied in order to do inference for comparing two population proportions. Construct a confidence interval for the difference between two population proportions. Perform a significance test for the difference between two population proportions. AP Outline Fit: IV. Statistical Inference: Estimating population parameters and testing hypotheses (30%–40%) A. Estimation (point estimators and confidence intervals) 5. Large sample confidence interval for a difference between two proportions 7. Confidence interval for a difference between two means B. Tests of significance 3. Large sample test for a difference between two proportions 5. Test for a difference between two means What you will learn: A. Recognition 1. Determine whether a problem requires inference about comparing means or proportions. 2. Recognize from the design of a study whether one-sample t, paired t, or two-sample t procedures are needed. B. Two-Sample t Procedures 1. Calculate and interpret a confidence interval for the difference between two means. Use the two-sample t statistic with conservative degrees of freedom if you do not have statistical software. Use the TI-83/84/89 or software if you have it. 2. Test the hypothesis that two populations have equal means against either a one-sided or a two-sided alternative. Use the two-sample t test with conservative degrees of freedom if you do not have statistical software. Use the TI83/84/89 or software if you have it. 3. Recognize when the two-sample t procedures are appropriate in practice. C. Comparing Two Proportions 1. Use the two-sample z procedure to give a confidence interval for the difference between proportions in two populations based on independent SRSs from the populations. 2. Use a two-proportion z test to test the hypothesis that proportions in two distinct populations are equal. 3. Check that you can safely use these z procedures in a particular setting. Chapter 13: Comparing Two Population Parameters Section 13.1: Comparing Two Means Knowledge Objectives: Students will: Describe the three conditions necessary for doing inference involving two population means. Clarify the difference between the two-sample z statistic and the two-sample t statistic. Construction Objectives: Students will be able to: Identify situations in which two-sample problems might arise. Identify the two practical options for using two-sample t procedures and how they differ in terms of computing the number of degrees of freedom. Conduct a two-sample significance test for the difference between two independent means using the Inference Toolbox. Compare the robustness of two-sample procedures with that of one-sample procedures. Include in your comparison the role of equal sample sizes. Explain what is meant by “pooled two-sample t procedures,” when pooling can be justified, and why it is advisable not to pool. Vocabulary: Statistics – Key Concepts: Classical and P-Value Approach – Two Means P-Value is the area highlighted Remember to add the areas in the two-tailed! -|t0| t0 |t0| -tα/2 -tα t0 tα/2 tα Critical Region (x1 – x2) – (μ1 – μ2 ) Test Statistic: t0 = ------------------------------s12 s22 ----- + ----n1 n2 Reject null hypothesis, if P-value < α Left-Tailed Two-Tailed t0 < - tα t0 < - tα/2 or t0 > tα/2 Right-Tailed t0 > t α 2 Sample t-Test: Degrees of Freedom: Since we don’t know the standard deviations we use the t-distribution for our test statistic. But we have a problem with calculating the degrees of freedom! We have two options: • Let our calculator handle the complex calculations and tell us what the degrees of freedom are • Use the smaller of n1 – 1 and n2 – 1 as a conservative estimate of the degrees of freedom Confidence Intervals t-Test Statistic • Since H0 assumes that the two population means are the same, our test statistic is reduce to: Test Statistic: (x1 – x2) t0 = ------------------------------s12 s22 ----- + ----n1 n2 • Similar in form to all of our other test statistics s1 2 s2 2 Lower Bound: (x1 – x2) – tα/2 ·----+ ----n1 n2 PE MOE s1 2 s2 2 Upper Bound: (x1 – x2) + tα/2 ·----+ ----n1 n2 tα/2 is determined using the smaller of n1 -1 or n2 -1 degrees of freedom x1 and x2 are the means of the two samples s1 and s2 are the standard deviations of the two samples Note: The two populations need to be normally distributed or the sample sizes large Chapter 13: Comparing Two Population Parameters Example 1: Does increasing the amount of calcium in our diet reduce blood pressure? Subjects in the experiment were 21 healthy black men. A randomly chosen group of 10 received a calcium supplement for 12 weeks. The control group of 11 men received a placebo pill that looked identical. The response variable is the decrease in systolic (top #) blood pressure for a subject after 12 weeks, in millimeters of mercury. An increase appears as a negative response. Data summarized below Subjects 1 2 3 4 5 6 7 8 9 10 11 Calcium 7 -4 18 17 -3 -5 1 10 11 -2 ---Control -1 12 -1 -3 3 -5 5 2 -11 -1 -3 a) Calculate the summary statistics. b) Test the claim • • • Step 1: Hypothesis H0: Ha: Step 2: Conditions SRS: Normality: Independence: Step 3: Calculations Test Statistic: • Step 4: Interpretation Example 2: The following data collected from two independently done simple random samples on average cell phone costs: Data Provider 1 Provider 2 n 23 13 x-bar 43.1 41.0 s 4.5 5.1 a) Test the claim that μ1 > μ2 at the α = 0.05 level of significance • • • Step 1: Hypothesis H0: Ha: Step 2: Conditions SRS: Normality: Independence: Step 3: Calculations Test Statistic: • Step 4: Interpretation b) Construct a 95% confidence interval about μ1 - μ2 Homework: pg 791: 13.7, 13.8, 13.11 and pg 804 13.17, 13.18, 13.23, 13.24 Chapter 13: Comparing Two Population Parameters Section 13.2: Comparing Two Proportions Knowledge Objectives: Students will: Identify the mean and standard deviation of the sampling distribution of 1 – 2. List the conditions under which the sampling distribution of 1 – 2 is approximately Normal. Identify the standard error of 1 – 2 when constructing a confidence interval for the difference between two population proportions. Identify the three conditions under which it is appropriate to construct a confidence interval for the difference between two population proportions. Explain why, in a significance test for the difference between two proportions, it is reasonable to combine (pool) your sample estimates to make a single estimate of the difference between the proportions. Explain how the standard error of 1 – 2 differs between constructing a confidence interval for 1 – 2 and performing a hypothesis test for . List the three conditions that need to be satisfied in order to do a significance test for the difference between two proportions. Construction Objectives: Students will be able to: Construct a confidence interval for the difference between two population proportions using the four-step Inference Toolbox for confidence intervals. Conduct a significance test for the difference between two proportions using the Inference Toolbox. Vocabulary: Combined sample proportion – Key Concepts: Confidence Interval – Difference in Two Proportions p2(1 – p2) Lower Bound: (p1 – p2) – zα/2 · p1(1 – p1) --------------- + -------------n1 n2 p2(1 – p2) Upper Bound: (p1 – p2) + zα/2 · p1(1 – p1) --------------- + -------------n1 n2 p1 and p2 are the sample proportions of the two samples Note: the same requirements hold as for the hypothesis testing Classical and P-Value Approach – Two Proportions P-Value is the area highlighted Remember to add the areas in the two-tailed! -|z0| z0 |z0| -zα/2 -zα z0 zα/2 zα Critical Region where p 1 – p2 Test Statistic: z0 = --------------------------------1 1 p (1- p) --- + --n1 n2 x1 + x2 p = -----------n 1 + n2 Reject null hypothesis, if P-value < α Left-Tailed Two-Tailed Right-Tailed z0 < - zα z0 < - zα/2 or z0 > zα/2 z0 > zα Chapter 13: Comparing Two Population Parameters Example 1: A study of the effect of pre-school had on later use of social services revealed the following data. Population Description Sample Size Social Service Proportion 1 Control 61 49 0.803 2 Preschool 62 38 0.613 Compute a 95% confidence interval on the difference between the control and Pre-school group proportions • Conditions: SRS Normality Independence • Calculations: • Conclusion: Example 2: We have two independent samples. 55 out of a random sample of 100 students at one university are commuters. 80 out of another random sample of 200 students at different university are commuters. We wish to know of these two proportions are equal. We use a level of significance α = .05 • • • Step 1: Hypothesis H0: Ha: Step 2: Conditions SRS: Normality: Independence: Step 3: Calculations Test Statistic: • Step 4: Interpretation Example 3: A sports medicine researcher for a university wishes to estimate the difference between the proportion of male athletes and female athletes who consume the USDA’s recommended daily intake of calcium. What sample size should he use if he wants to estimate to be within 3% at a 95% confidence level? a) if he uses a 1994 study as a prior estimate that found 51.1% of males and 75.2% of females consumed the recommended amount b) if he does not use any prior estimates Homework: pg 819 13.29, 13.30 and pg 821 13.33-35, 13.38 Chapter 13: Comparing Two Population Parameters Chapter 13: Review Objectives: Students will be able to: Summarize the chapter Define the vocabulary used Know and be able to discuss all sectional knowledge objectives Complete all sectional construction objectives Successfully answer any of the review exercises Identify the conditions that need to be satisfied in order to do inference for comparing two population means. Construct a confidence interval for the difference between two population means. Perform a significance test for the difference between two population means. Identify the conditions that need to be satisfied in order to do inference for comparing two population proportions. Construct a confidence interval for the difference between two population proportions. Perform a significance test for the difference between two population proportions. Vocabulary: None new TI-83 Calculator Help: 2 Sample t-Test and Confidence Interval • If you have raw data: – enter data in L1 and L2 • Press STAT, TESTS, select 2-SampT-Test – raw data: List1 set to L1, List2 set to L2 and freq to 1 – summary data: enter as before – Set Pooled to NO – copy off t* value and the degrees of freedom – – • • • • Confidence Intervals follow hypothesis test steps, except select 2-SampTInt and input confidence level 2 Sample Proportion Confidence Interval Press STAT – Tab over to TESTS – Select 2-PropZInt and ENTER • Entry x1, n1, x2, • Highlight Calculate and ENTER – Read interval information off n2, 2 Sample Proportion Test Press STAT – Tab over to TESTS – Select 2-PropZTest and ENTER • Entry x1, n1, x2, n2 • Highlight test type (p1≠ p2, p1<p2, or p2>p1) • Highlight Calculate and ENTER – Read z-critical and p-value off screen other information is there to verify Classical: compare Z0 with Zc (from table) P-value: compare p-value with α Homework: pg 827-30; 13.41-13.48 C-level


