Department of Basic Sciences MSc Statistics
advertisement
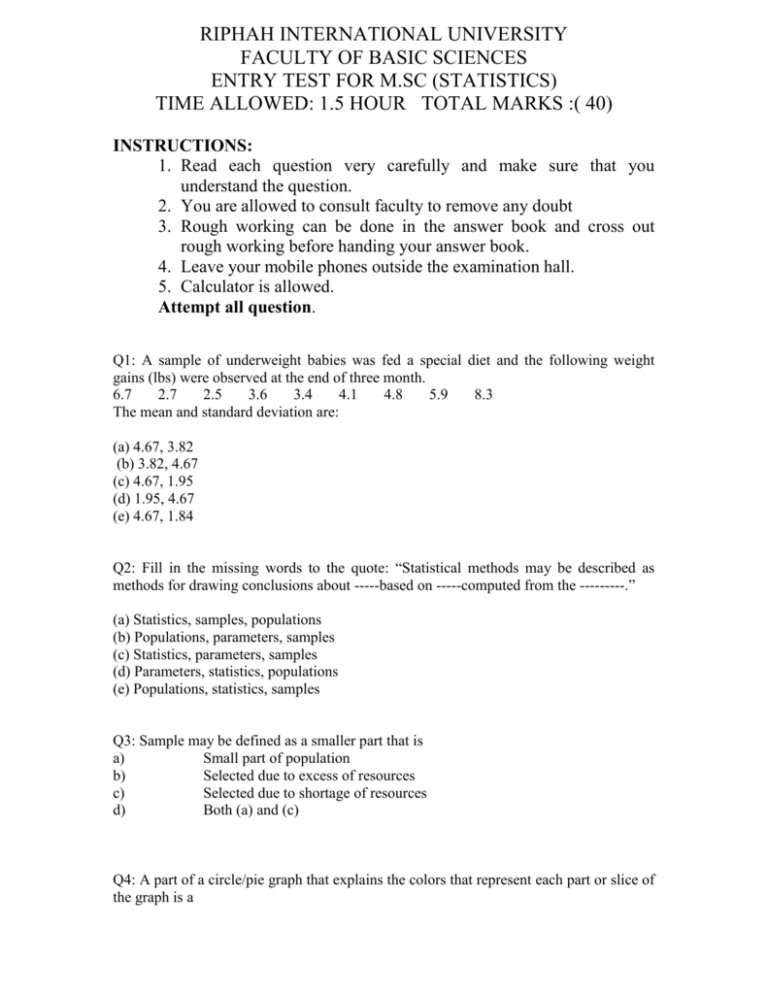
RIPHAH INTERNATIONAL UNIVERSITY FACULTY OF BASIC SCIENCES ENTRY TEST FOR M.SC (STATISTICS) TIME ALLOWED: 1.5 HOUR TOTAL MARKS :( 40) INSTRUCTIONS: 1. Read each question very carefully and make sure that you understand the question. 2. You are allowed to consult faculty to remove any doubt 3. Rough working can be done in the answer book and cross out rough working before handing your answer book. 4. Leave your mobile phones outside the examination hall. 5. Calculator is allowed. Attempt all question. Q1: A sample of underweight babies was fed a special diet and the following weight gains (lbs) were observed at the end of three month. 6.7 2.7 2.5 3.6 3.4 4.1 4.8 5.9 8.3 The mean and standard deviation are: (a) 4.67, 3.82 (b) 3.82, 4.67 (c) 4.67, 1.95 (d) 1.95, 4.67 (e) 4.67, 1.84 Q2: Fill in the missing words to the quote: “Statistical methods may be described as methods for drawing conclusions about -----based on -----computed from the ---------.” (a) Statistics, samples, populations (b) Populations, parameters, samples (c) Statistics, parameters, samples (d) Parameters, statistics, populations (e) Populations, statistics, samples Q3: Sample may be defined as a smaller part that is a) Small part of population b) Selected due to excess of resources c) Selected due to shortage of resources d) Both (a) and (c) Q4: A part of a circle/pie graph that explains the colors that represent each part or slice of the graph is a (a) Legend (b) Grid (c) Axis Q5: If In the bar graph above, students favorite activity is Note: Read the horizontal axis as 20, 40, 60, 80,…….,200. (a) Using the computer (b) Visiting with friends (c) Earning money Q6: Given below is a table Number of Cars Sold for the Month of February by Week Week Number Number of Cars Sold 1 20 2 37 3 13 4 10 The box or basic unit of the table that holds the data is called a (a) row (b) column (c) cell Q7: Suppose we have to show data of “student’s daily routine”, categorized on hourly basis, in categories (i) assignments solving (ii) rest (iii) analytic study (for preparation of examinations). Which of the diagram may serve the purpose a) Pictogram b) Pie chart c) Simple bar chart d) Multiple bar chart e) Pie chart or multiple bar chart Q8: One of the disadvantages of a pictogram is that it a) It is harder to interpret partial icons b) It cannot handle large data sets c) It is not quantitatively interpretable Q9: Processed data ( for compaction purpose) is usually called a) Raw data b) Grouped data c) Frequency distribution d) Both (b) and (c) e) None of the above Q10: The data 1, 2, 5, 8, 11, 0 , 19 may be called a) Null modal because there is no mode (each value occurs once) b) Multimodal with seven modes ( each value may be called most frequent as each occurs once) c) Both (a) and (b) Q11: When the data is in initial stage and has not been applied any processing, it is called ------. a) Raw data b) Ungrouped data c) Fresh data d) All of the above Q12: Data A has coefficient of variation of 4% and Data B has coefficient of variation of 1%. A valid statement is a) Data A has more variability b) Data B has more variability (c ) Nothing can be said with surety, unless we know each data’s mean and standard deviation. Q13: The key element of the ________statistic is the ratio ( ) which compares the ratio of the sample standard deviation to the target standard deviation. a) T b) Z c) None of above d) Chi-square Q14: In contingency tables with ‘r’ rows and ‘c’ columns, the degrees of freedom of the chi-square test is a) (r-1) ( c-1) b) r-1/c-1 c) r+c-1 Q15: By inferences we may mean making conclusions about the ________ based on sample. a) Sample b) Population Q16: Obeying the statistical rules, a good sample is selected _________ from _____ a) Non-randomly, population b) Randomly, population c) Following personal choices, sample Q17: Sampling is that part of statistical practice which is concerned with the selection of individual observations. a) True b) False Q18: Consider a population of potato sacks, each of which has either 12, 13, 14, 15, 16, 17, or 18 potatoes, and all the values are equally likely. Suppose that, in this population, there is exactly one sack with each number. So the whole population has seven sacks. a) True b) False Q19: In simple random sampling with replacement, each observation has ______ chance of being selected. a) Equal but unknown b) Equal and known c) Unequal and unknown Q 20 : The branch of statistics that deals with collection and depiction of data is called -------a) Descriptive statistics b) Mathematical modeling c) Inferential statistics Q 21: Continuous variable can assume every possible value within the given range a) True b) False Q 22: Variables are only quantitative a) True b) False Q 23: A collection or a set of all possible observations, whether finite or infinite, relevant to some characteristics of interest is called a) Population b) Sample c) Variable d) Constant Q 24: The arithmetic mean for the below mentioned data is --------Class f 0----1 2 1---2 1 2----3 3 4----5 5 5----6 6 6----7 2 a) 3.6 b) 3.4 c) 4.2 d) 2.0 Q 25: The most frequent observation of a data is called a) Variance b) Median c) Mode Q 26: The Range and the Mean of the following data are ( respectively) 1, 1, 1, 2, 2, 2, 2, 3, 3, 1, 2. a) 2 and 1.8182 b) 2 and 2 c) 1 and 1.8182 d) 0 and 1.8182 Q 27: The Variance of the following data is 1, 1, 1, 2, 2, 2, 2, 3, 3, 1, 2. a) 0.65 b) 0.56 c) 2.12 Q 28: In a symmetric distribution the Mean, Median and Mode are equal. (a) True (b) False. Q 29: There are three quartiles. a) True b) False Q 30: The formula for ------- is =[3(n+1)/4] item, and 75 % data lies before it. a) Q 3 b) P75 c) Both (a) and (b) Q 31: Suppose that we have to estimate the population mean of a non-normal variable. Moreover the population variance is known and a sample of size hundred is drawn , we shall use a. T- distribution b. Z-distribution Q 32: a. Type –I error b. Type-II error Q 33: C.V=S.D/Mean a) True b) False Q 34: Lesser the-------, lesser is the variability in the data a) Variance b) Arithmetic mean and coefficient of variation c) Coefficient of variation Q 35: Mean, Median and Mode coincide in which of the following distributions a) Normal distribution b) T-distribution Q36: Standard normal variable is defined as, a) A variable which has mean zero and variance one. b) A variable which follows normal distribution, with mean zero and variance one. c) A non-normal variable that is formed using another normal variable. Q 37: Normal distribution is a --------distribution a) Continuous b) Bell-shaped c) Symmetric d) All of above Q 38: Estimation is one of the two important concerns of Inferential Statistics, the other is------------. a) Reporting summary values for the population b) Testing of hypothesis Q 39: In a normal distribution almost all the data is concentrated a) Within three sigma around the mean b) Within two sigma around the mean s c) Within one sigma around the mean Q 40: A -------may displays data as a percentage of the whole. a) pie chart b) Frequency Polygon c) Histogram


