Review Questions
advertisement
University of Illinois at Chicago
School of Public Health
Division of Epidemiology & Biostatistics
BSTT 580
Instructor
Textbook
Applied Multivariate Statistical Analysis
Stan Sclove
Johnson & Wichern, 4th ed. (JW)
REVIEW QUESTIONS
Any undefined notation is either standard or that of JW.
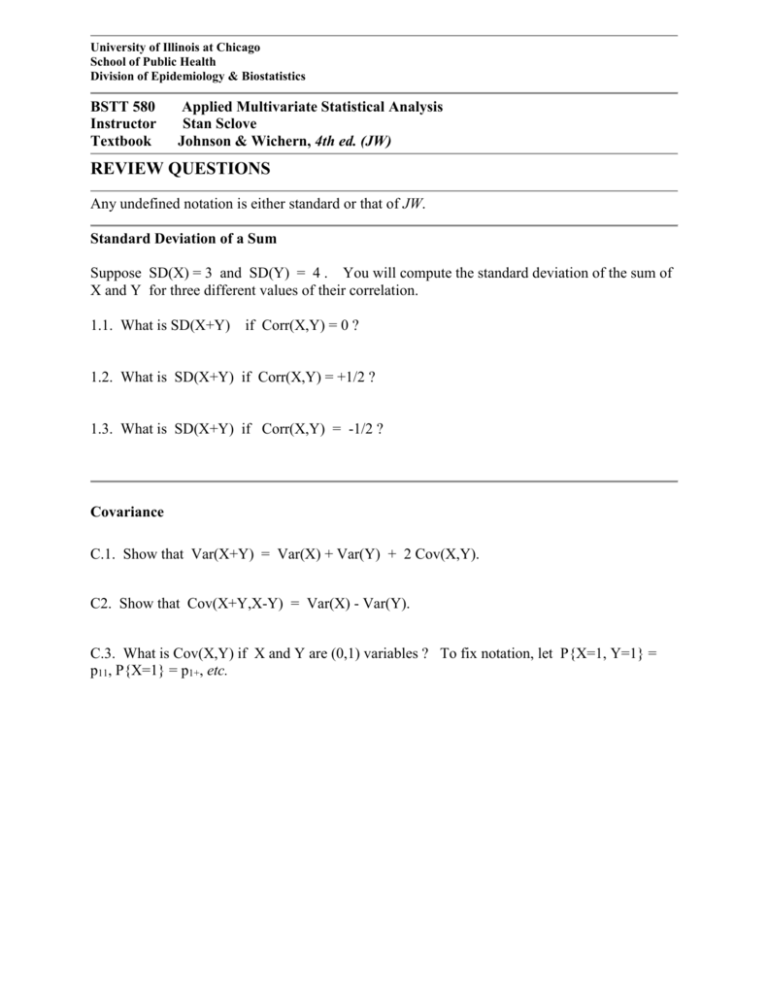
Standard Deviation of a Sum
Suppose SD(X) = 3 and SD(Y) = 4 . You will compute the standard deviation of the sum of
X and Y for three different values of their correlation.
1.1. What is SD(X+Y)
if Corr(X,Y) = 0 ?
1.2. What is SD(X+Y) if Corr(X,Y) = +1/2 ?
1.3. What is SD(X+Y) if Corr(X,Y) = -1/2 ?
Covariance
C.1. Show that Var(X+Y) = Var(X) + Var(Y) + 2 Cov(X,Y).
C2. Show that Cov(X+Y,X-Y) = Var(X) - Var(Y).
C.3. What is Cov(X,Y) if X and Y are (0,1) variables ? To fix notation, let P{X=1, Y=1} =
p11, P{X=1} = p1+, etc.
Testing the Mean Vector of a Multivariate Normal Distribution
A random sample of n = 16 observations is drawn from a bivariate normal distribution. It
is known that Var(X) = 4, Var(Y) = 64, and Cov(X,Y) = 12. The mean of X, E(X) , and the
mean of Y, E(Y) , are unknown. The sample means are 2 for X and 4 for Y.
Make a two-tailed test of the hypothesis that the true mean of X is 3, as follows.
MV.1. What is the value of z for this test ?
(A)
2
(B) 0.5
(C) 0
(D) -0.5
(E) -2
MV.2. What is the achieved level of significance (p-value)?
(A) .8413
(B) .6826
(C) .3085
(D) .0456
(E) .0228
Make a two-tailed test of the hypothesis that the true mean of Y is 3, as follows.
MV.3.
(A)
What is the value of z for this test ?
2
(B) 0.5
(C) 0
(D) -0.5
(E) -2
MV.4. What is the achieved level of significance (p-value)?
(A) .9772
(B) .6170
(C) .3085
(D) .0456
(E) .0228
The sample mean vector is (2,4)'. Test the hypothesis that the true mean vector is (3,3)'. The
test statistic is the squared statistical distance, D2, between the sample mean vector and (3,3)',
in the metric of the covariance matrix of the sample mean vector. Make the test, as follows.
MV.5. Begin by computing the inverse of the covariance matrix of (X,Y).
MV.6. Compute the value of D2.
MV.7. When the hypothesis is true, the distribution of D2 is chi-square with two degrees of
freedom. It can be shown that the p-value (achieved level of significance) of chi-square with 2
d.f. is exp(-v/2), where v is the value of D2 obtained above. Find the p-value.
Part 3.
Equicorrelation Matrix
Let M denote the equicorrelation matrix. Let p denote the number of variables and denote
the common value of the correlation coefficients.
EM.1. If M = a I + b 1 1', where I is the p-by-p identity matrix and 1 is the pdimensional column vector of all 1's, then
a = ? _______
b = ? _______
EM.2.
If
is positive, what is the largest eigenvalue of M ? __________________
EM.3. (continuation) What is the common value of the other eigenvalues of
__________________
EM.4.
M?
What is the multiplicity of this smaller root of M ? ________________
EM.5.
What is the determinant of M ? ________________
______________________________________________________________________________
Eigensystem
What is the eigensystem of a 2 x 2 correlation matrix?
______________________________________________________________________________
Factor Analysis
Considering factor analysis based on the correlation matrix, show that there is one and only one
set of factor-analysis parameters (loadings and uniquenesses) for the case m=1, p=3.
Classification
A test is used to decide whether a particular disease is present in individuals. Suppose we denote
the presence of the disease by D, the absence by A, the decision that the disease is present by d,
and the decision that the disease is absent by a. What is the specificity of the test? What is the
sensitivity of the test? What is the Predictive Value of a Negative Test? What is the
Predictive Value of a Positive Test?
Quadratic Discriminant
Consider the following situation: p = 1 variable, height;
g = 2, Male - N(", "), Female - N(", "), p1 = p2; c(1|2)
= c(2|1) .
The classification region R2 can be described as R2 = {x: x2 + bx + c > 0}.
b = ? _________________
c = ? _________________
Thus the classification region R2 is an interval, (l,u). What are the values l and u ?
l = ? _________________
u = ? _________________
Locations of Disease Occurrences
Suppose that two easily confused diseases spread from the origin, 0' = (0, 0)'. The rate
of spread of Disease 2 is higher than that of Disease 1. You will be trying to guess the disease,
just from the place of occurrence.
p = 2 variables, the coordinates of occurrences of the diseases;
g = 2, Disease 1 - N2(4), Disease 2 - N2(9),
p1 = p2; c(1|2) = c(2|1) .
(The standard deviations correspond to the diffusion rates, i.e., the rates of spread of the
diseases.)
Compute the numerical value of P{(| x' = (0, 0)'}
Logistic Regression: Data Analysis
This concerns a logistic regression example for the breaking strength of wire.
TABLE. Data on breaking strength of wires.
proportion
No. of wires
breaking
weight (lbs.)
N
p
x
100
.04
10
100
.08
20
100
.20
30
100
.76
40
100
.90
50
The regression was fitted by weighted least squares. The regression equation is
Logit(P) = - 5.51 + 0.156 Weight.
a) Estimate the weight at which half the wires would break.
b) i) Using this logistic regression model, estimate the weight at which 90% of the wires
would break.
ii) In the dataset, 90% of the wires broke at 50 lbs. Is 50 lbs. higher or lower than your
estimate according to the logistic regression model?
Structural Equation Modeling: Single-Factor Model
Suppose
X = .8 F + U
and
Y = .9 F + V,
where Var(F) = 1, Var(U) = 1, Var(V) = 1, Corr(U,V) = 0, Corr(F,U) = 0, and Corr(F,V) = 0.
SEM.1 What is the covariance of X and Y ?
SEM.2. What is SD(X) ?
SEM.3. What is SD(Y) ?
SEM.4. What is Corr(X,Y) = ?
Created: 11 November 1999
Updated: 24 Nov 2000
