Standard Error Summary
advertisement
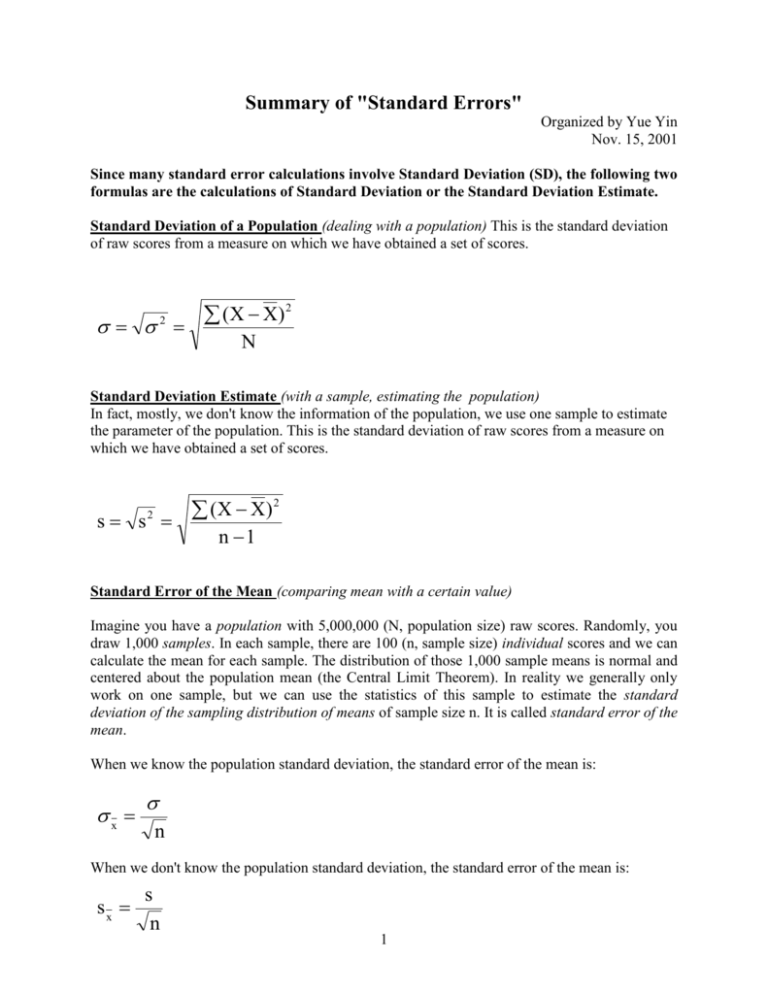
Summary of "Standard Errors" Organized by Yue Yin Nov. 15, 2001 Since many standard error calculations involve Standard Deviation (SD), the following two formulas are the calculations of Standard Deviation or the Standard Deviation Estimate. Standard Deviation of a Population (dealing with a population) This is the standard deviation of raw scores from a measure on which we have obtained a set of scores. (X X) 2 2 N Standard Deviation Estimate (with a sample, estimating the population) In fact, mostly, we don't know the information of the population, we use one sample to estimate the parameter of the population. This is the standard deviation of raw scores from a measure on which we have obtained a set of scores. (X X) 2 s s 2 n 1 Standard Error of the Mean (comparing mean with a certain value) Imagine you have a population with 5,000,000 (N, population size) raw scores. Randomly, you draw 1,000 samples. In each sample, there are 100 (n, sample size) individual scores and we can calculate the mean for each sample. The distribution of those 1,000 sample means is normal and centered about the population mean (the Central Limit Theorem). In reality we generally only work on one sample, but we can use the statistics of this sample to estimate the standard deviation of the sampling distribution of means of sample size n. It is called standard error of the mean. When we know the population standard deviation, the standard error of the mean is: x n When we don't know the population standard deviation, the standard error of the mean is: sx s n 1 s = standard deviation estimate (based on one sample) n = number of observations/cases/individuals in the sample Standard Error of the Difference (Independent T-test) Suppose that a variable is normally distributed in each of two populations, and that the populations have equal means and equal standard deviations (1 = 2, 1 = 2). If many pairs of random samples of equal size were drawn from the two populations, a distribution of differences between the paired means (X1-X2)1 could be established. The mean of the differences will be equal to 1 - 2 , which in this case is zero. The standard deviation of all the differences is called the standard error of the difference. It tells how much, on the average, a given (X1-X2) is likely to differ from the true difference of zero. Since it is assumed that the two population variances are equal, the variances of each of the two samples may be combined into a single estimate of the common value of 2. s 2 pooled (n1 1)s12 (n 2 1)s 22 n1 n 2 2 s1 = population standard deviation estimate of sample 1 s2 = population standard deviation estimate of sample 2 n1 = number of cases in sample 1 n2 = number of cases in sample 2 The standard error of the difference is s x x 1 2 s 2pooled n1 s 2pooled n2 s 2pooled ( 1 1 ) n1 n 2 The two steps given above can be combined into a single formula, as follows: s x x 1 2 (n1 1)s12 (n 2 1)s 22 1 1 ( ) n1 n 2 2 n1 n 2 Standard Error of Sampling Correlation Coefficient rXY (comparing r with a specified value) 1 Here, for both X1 and X2, there should be a bar "-" above it. 2 Only when r has been transformed to Z score by Fisher's Z transformation -- in Table I we used in our class-- the standard error of the transformed correlation coefficient is: 1 n 3 sZ Standard Error of the difference between correlations (comparing two groups' r) Only when rs have been transformed to Z scores by Fisher's Z transformation --in Table I we used in our class--the standard error of the difference between correlation coefficients is: s r r 1 2 1 1 n1 3 n 2 3 Standard Error of Estimate (Regression) It measures the error in predicting Y from X. It is a magnitude of error made in estimating Y from X.2 Y Y 2 s Y.X p n 2 sY.X = standard error of estimate Y = actual value(s) of Y for a given value of X Yp = predicted value Y for a given value of X n = number of observations 2 In the formula, there should be a sum operator in front of the (Y-Yp). For unknown reason, it cannot show up here. 3


