Full description of statistical methods - PRE-EMPT
advertisement
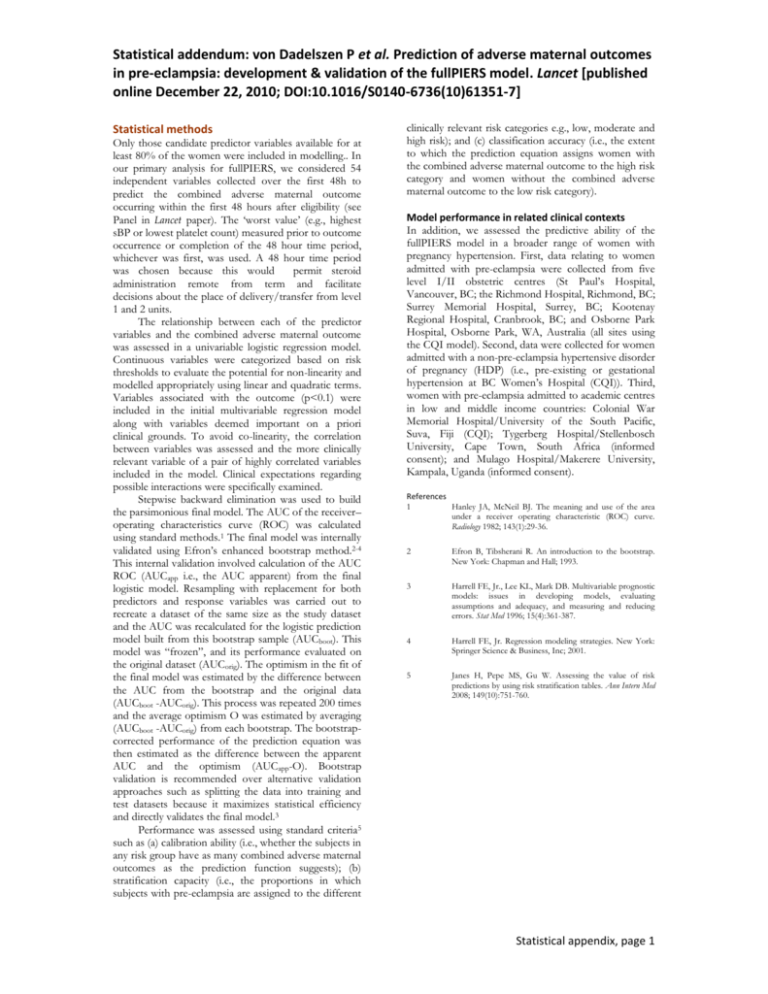
Statistical addendum: von Dadelszen P et al. Prediction of adverse maternal outcomes in pre-eclampsia: development & validation of the fullPIERS model. Lancet [published online December 22, 2010; DOI:10.1016/S0140-6736(10)61351-7] Statistical methods Only those candidate predictor variables available for at least 80% of the women were included in modelling.. In our primary analysis for fullPIERS, we considered 54 independent variables collected over the first 48h to predict the combined adverse maternal outcome occurring within the first 48 hours after eligibility (see Panel in Lancet paper). The ‘worst value’ (e.g., highest sBP or lowest platelet count) measured prior to outcome occurrence or completion of the 48 hour time period, whichever was first, was used. A 48 hour time period was chosen because this would permit steroid administration remote from term and facilitate decisions about the place of delivery/transfer from level 1 and 2 units. The relationship between each of the predictor variables and the combined adverse maternal outcome was assessed in a univariable logistic regression model. Continuous variables were categorized based on risk thresholds to evaluate the potential for non-linearity and modelled appropriately using linear and quadratic terms. Variables associated with the outcome (p<0.1) were included in the initial multivariable regression model along with variables deemed important on a priori clinical grounds. To avoid co-linearity, the correlation between variables was assessed and the more clinically relevant variable of a pair of highly correlated variables included in the model. Clinical expectations regarding possible interactions were specifically examined. Stepwise backward elimination was used to build the parsimonious final model. The AUC of the receiver– operating characteristics curve (ROC) was calculated using standard methods.1 The final model was internally validated using Efron’s enhanced bootstrap method.2-4 This internal validation involved calculation of the AUC ROC (AUCapp i.e., the AUC apparent) from the final logistic model. Resampling with replacement for both predictors and response variables was carried out to recreate a dataset of the same size as the study dataset and the AUC was recalculated for the logistic prediction model built from this bootstrap sample (AUCboot). This model was “frozen”, and its performance evaluated on the original dataset (AUCorig). The optimism in the fit of the final model was estimated by the difference between the AUC from the bootstrap and the original data (AUCboot -AUCorig). This process was repeated 200 times and the average optimism O was estimated by averaging (AUCboot -AUCorig) from each bootstrap. The bootstrapcorrected performance of the prediction equation was then estimated as the difference between the apparent AUC and the optimism (AUCapp-O). Bootstrap validation is recommended over alternative validation approaches such as splitting the data into training and test datasets because it maximizes statistical efficiency and directly validates the final model.3 Performance was assessed using standard criteria5 such as (a) calibration ability (i.e., whether the subjects in any risk group have as many combined adverse maternal outcomes as the prediction function suggests); (b) stratification capacity (i.e., the proportions in which subjects with pre-eclampsia are assigned to the different clinically relevant risk categories e.g., low, moderate and high risk); and (c) classification accuracy (i.e., the extent to which the prediction equation assigns women with the combined adverse maternal outcome to the high risk category and women without the combined adverse maternal outcome to the low risk category). Model performance in related clinical contexts In addition, we assessed the predictive ability of the fullPIERS model in a broader range of women with pregnancy hypertension. First, data relating to women admitted with pre-eclampsia were collected from five level I/II obstetric centres (St Paul’s Hospital, Vancouver, BC; the Richmond Hospital, Richmond, BC; Surrey Memorial Hospital, Surrey, BC; Kootenay Regional Hospital, Cranbrook, BC; and Osborne Park Hospital, Osborne Park, WA, Australia (all sites using the CQI model). Second, data were collected for women admitted with a non-pre-eclampsia hypertensive disorder of pregnancy (HDP) (i.e., pre-existing or gestational hypertension at BC Women’s Hospital (CQI)). Third, women with pre-eclampsia admitted to academic centres in low and middle income countries: Colonial War Memorial Hospital/University of the South Pacific, Suva, Fiji (CQI); Tygerberg Hospital/Stellenbosch University, Cape Town, South Africa (informed consent); and Mulago Hospital/Makerere University, Kampala, Uganda (informed consent). References 1 Hanley JA, McNeil BJ. The meaning and use of the area under a receiver operating characteristic (ROC) curve. Radiology 1982; 143(1):29-36. 2 Efron B, Tibsherani R. An introduction to the bootstrap. New York: Chapman and Hall; 1993. 3 Harrell FE, Jr., Lee KL, Mark DB. Multivariable prognostic models: issues in developing models, evaluating assumptions and adequacy, and measuring and reducing errors. Stat Med 1996; 15(4):361-387. 4 Harrell FE, Jr. Regression modeling strategies. New York: Springer Science & Business, Inc; 2001. 5 Janes H, Pepe MS, Gu W. Assessing the value of risk predictions by using risk stratification tables. Ann Intern Med 2008; 149(10):751-760. Statistical appendix, page 1
