6.1 Reading Guide key
advertisement
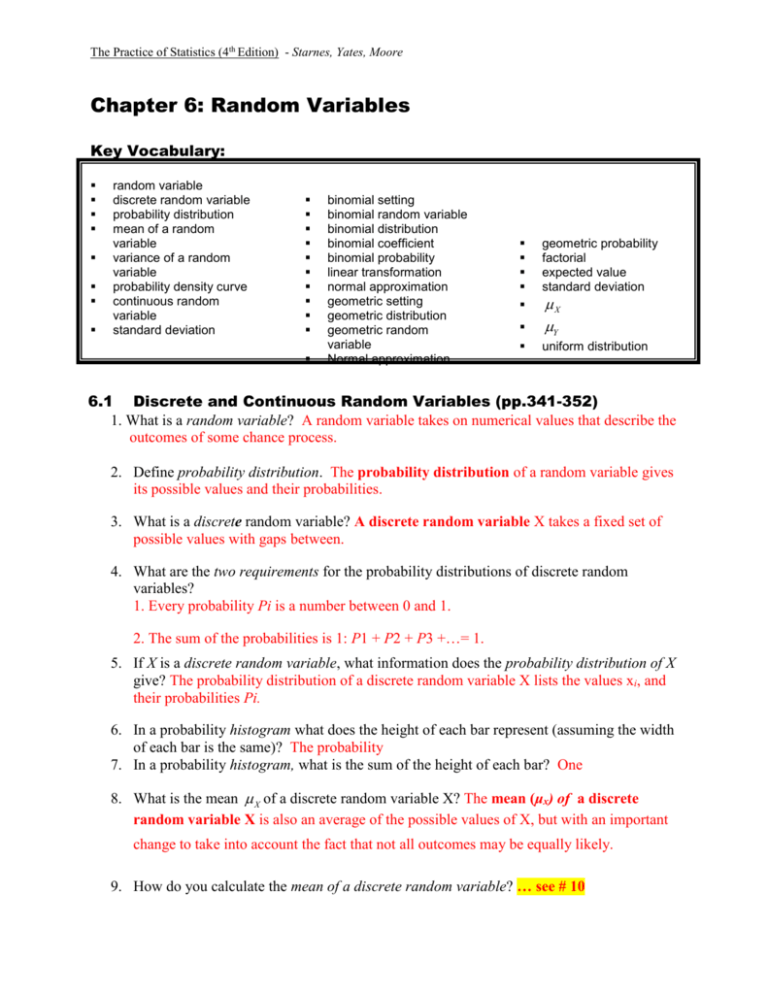
The Practice of Statistics (4th Edition) - Starnes, Yates, Moore Chapter 6: Random Variables Key Vocabulary: random variable discrete random variable probability distribution mean of a random variable variance of a random variable probability density curve continuous random variable standard deviation binomial setting binomial random variable binomial distribution binomial coefficient binomial probability linear transformation normal approximation geometric setting geometric distribution geometric random variable Normal approximation geometric probability factorial expected value standard deviation X Y uniform distribution 6.1 Discrete and Continuous Random Variables (pp.341-352) 1. What is a random variable? A random variable takes on numerical values that describe the outcomes of some chance process. 2. Define probability distribution. The probability distribution of a random variable gives its possible values and their probabilities. 3. What is a discrete random variable? A discrete random variable X takes a fixed set of possible values with gaps between. 4. What are the two requirements for the probability distributions of discrete random variables? 1. Every probability Pi is a number between 0 and 1. 2. The sum of the probabilities is 1: P1 + P2 + P3 +…= 1. 5. If X is a discrete random variable, what information does the probability distribution of X give? The probability distribution of a discrete random variable X lists the values xi, and their probabilities Pi. 6. In a probability histogram what does the height of each bar represent (assuming the width of each bar is the same)? The probability 7. In a probability histogram, what is the sum of the height of each bar? One 8. What is the mean X of a discrete random variable X? The mean (μx) of a discrete random variable X is also an average of the possible values of X, but with an important change to take into account the fact that not all outcomes may be equally likely. 9. How do you calculate the mean of a discrete random variable? … see # 10 The Practice of Statistics (4th Edition) - Starnes, Yates, Moore 10. How do you calculate the mean of a discrete random variable? To find the mean (expected value) of X, multiply each possible value by its probability, then add all the products. 11. Define expected value. What notation is used for expected value? The mean; E(X) 12. Does the expected value of a random variable have to equal one of the possible values of the random variable? Explain. No. The mean is a long-run average over many repetitions, therefore having an expected value not equal one of the possible values is not an unlikely occurrence. 13. Explain how to calculate the variance and standard deviation of a discrete random variable. The variance is an average of the squared deviation (xi – μx)2 of the values of the variable X from its mean μx. The standard deviation of X, σx, is the square root of the variance. 14. Explain the meaning of the standard deviation of a random variable X. The standard deviation of a random variable X is a measure of how much the values of the variable tend to vary, on average, from the mean μx. 15. What is a continuous random variable and how is it displayed? A continuous random variable X takes all values in an interval of numbers. The probability distribution of X is described by a density curve. The probability of any event is the area under the density curve and above the values of X that make up the event. 16. If X is a continuous random variable, how is the probability distribution of X described? The probability distribution for a continuous random variable assigns probabilities to intervals of outcomes rather than to individual outcomes. 17. What is the area under a probability density curve equal to? It is always equal to 1. 18. What is the difference between a discrete random variable and a continuous random variable? We call Y a continuous random variable because its values are not isolated numbers but rather an entire interval of numbers. In many cases, discrete random variables arise from counting something; continuous random variables often arise from measuring something. 19. If X is a discrete random variable, do P X 2 and P X 2 have the same value? Explain. (Discuss in class) 20. If X is a continuous random variable, do P X 2 and P X 2 have the same value? Explain. (Discuss in class) The Practice of Statistics (4th Edition) - Starnes, Yates, Moore 21. How is a Normal distribution related to probability distribution? Normal distributions can be probability distributions as well as descriptions of data. There is a close connection between a Normal distribution as an idealized description for data and a Normal probability model 6.2 Transforming and Combining Random Variables (pp. 358-375) 1. What is the effect on a random variable of multiplying or dividing by a constant? Multiplying (or dividing) each value of a random variable by a number b: Multiplies (divides) measures of center and location (mean, median, quartiles, percentiles) by b. Multiplies (divides) measures of spread (range, IQR, standard deviation) by |b|. Does not change the shape of the distribution. 2. How does multiplying by a constant effect the variance? The variance is multiplied by the constant. 3. What is the effect on a random variable of adding or subtracting by a constant? Adding the same number a (which could be negative) to each value of a random variable: Adds a to measures of center and location (mean, median, quartiles, percentiles). Does not change shape or measures of spread (range, IQR, standard deviation). 4. Define linear transformation. Transforming a random variable by both adding or subtracting a constant and multiplying or dividing by a constant. 5. What are the effects of a linear transformation on the mean and standard deviation? If Y = a + bX is a linear transformation of the random variable X, then the probability distribution of Y has the same shape as the probability distribution of X. μy = a + bμx. AND σy = |b|σx (since b could be a negative number). 6. Define the mean of the sum of random variables. For any two random variables X and Y, if T = X + Y, then the expected value of T is E(T) = μT = μX + μY. In general, the mean of the sum of several random variables is the sum of their means. 7. What are independent random variables? If knowing whether any event involving X alone has occurred tells us nothing about the occurrence of any event involving Y alone, and vice versa, then X and Y are independent random variables. 8. Define the variance of the sum of independent random variables. What types of variables does it apply to? For any two independent random variables X and Y, if T = X + Y, then the variance of T is In general, the variance of the sum of several independent random variables is the sum of their variances. The Practice of Statistics (4th Edition) - Starnes, Yates, Moore 9. When can you add the variances of two random variables? When adding two independent random variables, variances add. Standard deviations do not add. 10. State the equation for the mean of the difference of random variables? For any two random variables X and Y, if D = X − Y, then the expected value of D is E(D) = μD = μX − μY. In general, the mean of the difference of several random variables is the difference of their means. 11. State the formula for the variance of the difference of random variables. For any two independent random variables X and Y, if D = X − Y, then the variance of D is 12. What happens if two independent Normal random variables are combined? Any sum or difference of independent Normal random variables is also Normally distributed. The mean and standard deviation of the resulting Normal distribution can be found using the appropriate rules for means and variance Go over #13-16 in class 13. Suppose X = 5 and Y = 10. According to the rules for means, what is X Y ? 14. Suppose X = 2. According to the rules for means, what is 3 4 X ? 15. Suppose X2 = 2 and Y2 = 3 and X and Y are independent random variables. According to the rules for variances, what is X2 Y ? What is X Y ? 16. Suppose X2 = 4. According to the rules for variances, what is 32 4 X ? What is 3 4 X ? 6.3 Binomial and Geometric Random Variables (pp.382-401) 1. What is a binomial setting? A binomial setting arises when we perform several independent trials of the same chance process and record the number of times that a particular outcome occurs. 2. Describe the conditions of a binomial setting.The four conditions for a binomial setting are: Binary? The possible outcomes of each trial can be classified as “success” or “failure.” Independent? Trials must be independent; that is, knowing the result of one trial must not have any effect on the result of any other trial. Number? The number of trials n of the chance process must be fixed in advance. Success? On each trial, the probability p of success must be the same. 3. What is a binomial random variable and what are its possible values? The count X of successes in a binomial setting is a binomial random variable. The Practice of Statistics (4th Edition) - Starnes, Yates, Moore 4. Define the parameters of a binomial distribution. The probability distribution of X is a binomial distribution with parameters n and p, where n is the number of trials of the chance process and p is the probability of a success on any one trial. The possible values of X are the whole numbers from 0 to n. 5. Explain the meaning of the binomial coefficient and state the formula. The number of ways of arranging k successes among n observations is given by the binomial coefficient 6. Explain how to calculate binomial probabilities. If X has the binomial distribution with n trials and probability p of success on each trial, the possible values of X are 0, 1, 2,…, n. If k is any one of these values, With our formula in hand, we can now calculate any binomial probability 7. What commands on the calculator are used to calculate binomial probabilities? binompdf(n,p,k) computes P(X = k) (2ND/VARS) binompdf(n,p,k) binomcdf(n,p,k) computes P(X ≤ k) (2ND/VARS) binomcdf(n,p,k) 8. Explain how to calculate the mean and standard deviation of a binomial random variable. If a count X has the binomial distribution with number of trials n and probability of success p, the mean and standard deviation of X are 9. When can the binomial distribution be used to sample without replacement? Explain why this is an issue. (Discuss in class) 10. What is a geometric setting? A geometric setting arises when we perform independent trials of the same chance process and record the number of trials until a particular outcome occurs. 11. Describe the conditions for a geometric setting. The four conditions for a geometric setting are Binary? The possible outcomes of each trial can be classified as “success” or “failure.” Independent? Trials must be independent; that is, knowing the result of one trial must not have any effect on the result of any other trial. Trials? The goal is to count the number of trials until the first success occurs. Success? On each trial, the probability p of success must be the same. The Practice of Statistics (4th Edition) - Starnes, Yates, Moore 12. What is a geometric random variable and what are its possible values? The number of trials Y that it takes to get a success in a geometric setting is a geometric random variable. The possible values of Y are 1, 2, 3,…. 13. Describe the parameters of a geometric distribution. The probability distribution of Y is a geometric distribution with parameter p, the probability of a success on any trial. 14. What is the formula for geometric probability? If X has the geometric distribution with probability of success p, the possible values of Y are the positive integers 1, 2, 3,…. The geometric probability that Y takes any value is P(Y = k) = (1 − p)k − 1p 15. How is the mean of a geometric random variable calculated? The mean (expected value) of a geometric random variable X is 1/p.


