Two-Tailed Tests about a Population Mean: Large Sample Case
advertisement
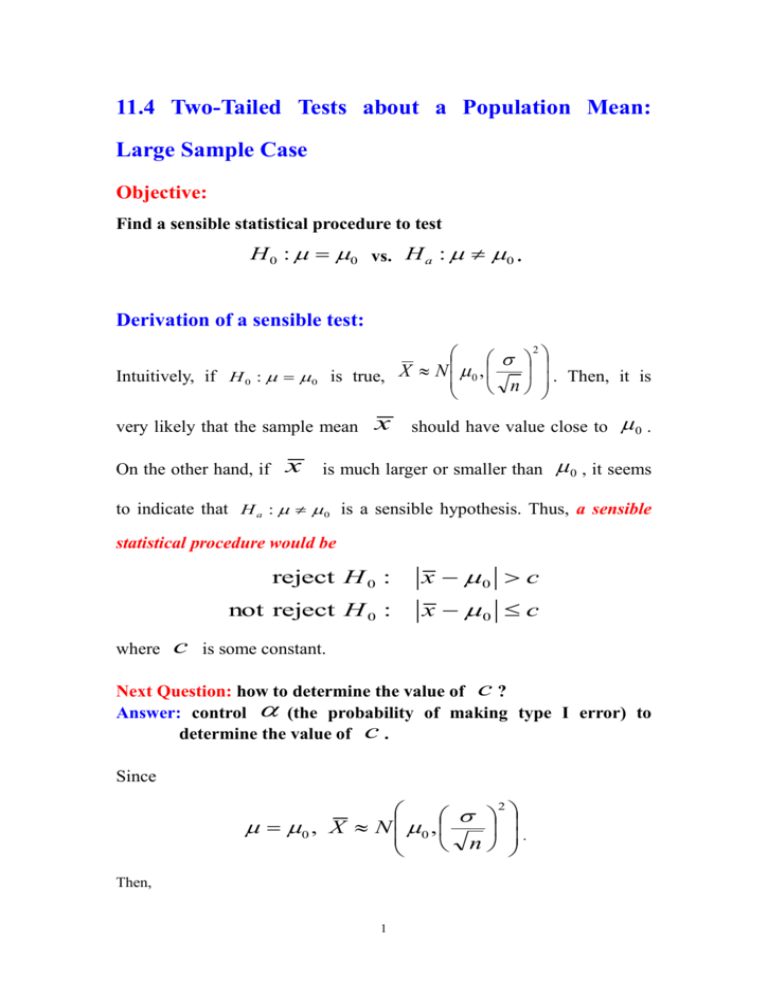
11.4 Two-Tailed Tests about a Population Mean: Large Sample Case Objective: Find a sensible statistical procedure to test H 0 : 0 vs. H a : 0 . Derivation of a sensible test: 2 . Then, it is is true, X N 0 , n Intuitively, if H 0 : 0 very likely that the sample mean On the other hand, if x x should have value close to is much larger or smaller than 0 . 0 , it seems to indicate that H a : 0 is a sensible hypothesis. Thus, a sensible statistical procedure would be where c reject H 0 : x 0 c not reject H 0 : x 0 c is some constant. Next Question: how to determine the value of c ? Answer: control (the probability of making type I error) to determine the value of c . Since 2 0 , X N 0 , . n Then, 1 the probabilit y that wro ngly reject H 0 P( H 0 is true but is rejected) P 0 ; X 0 c X 0 c c P P Z n n n c n z c z 2 Thus, x 0 reject H 0 : x 0 not reject H 0 : 2 n . z 2 n z 2 n is a sensible statistical procedure. Furthermore, denote z Thus, by dividing n x 0 X x 0 . n on the both sides, the above sensible statistical procedure can be simplified to reject H 0 : z z not reject H 0 : z z 2 2 In addition, p - value the probabilit y of making type I error by rejecting H 0 at x as 0 P X 0 x 0 , 0 P Z z 2 X 0 x 0 P , 0 n n Example: Objective: check if the produced golf balls have an average distance in carry and roll of 280 yards as n 36, x 278.5, 12 and 0.05 , [solutions:] H 0 : 0 280 vs. H a : 0 280 . Then, z x 0 278.5 280 0.75 . 12 n 36 Since z 0.75 0.75 z z 0.025 1.96 , 2 we thus do not reject H 0 . In addition, p - value P Z z P Z 0.75 P Z 0.75 0.4532 0.05 Therefore, we can not reject H 0 General Case: as n 30 and level of significance H 0 : 0 vs H a : 0 As is known, let z x 0 X x 0 . n Then, reject H 0 : z z not reject H 0 : z z In addition, 3 2 2 p - value P Z z As is unknown, z x 0 x 0 sX s . n Then, In addition, reject H 0 : z z not reject H 0 : z z 2 2 p - value P Z z Interval estimation and hypothesis testing For H 0 : 0 vs. H a : 0 with known, we do not reject H 0 as z x 0 z 2 z 2 0 x z 2 n z n n 2 x z 0 x z 2 n n 2 0 x z 2 n 0 falls into x z , x z 2 2 n n 0 falls into 1 100% confidence interval for 4 On the other hand, we reject H 0 as 0 x z , x z 2 n n 0 do not falls into 1 100% confidence interval for 2 Note: Since for any H 0 : 0 H a : 0 , vs. P Z z , 0 1 P Z z , 0 . 2 2 Thus, X X 0 1 P Z z , 0 P z P 0 z 2 2 2 n n 0 X P z z P z 0 X z 2 2 2 2 n n n P X z 0 X z 2 2 n n Example (continue): In the previous example, n 36, x 278.5, 12 , 0.05 H 0 : 0 280 vs. H a : 0 280 . We can also use confidence interval approach to hypothesis testing. A 95% confidence interval for is x z 0.05 Since 2 n 278.5 1.96 12 36 278.5 3.92 274.58, 282.42 0 280 274.58, 282.42 , we do not reject 5 H0 . A confidence Interval approach to hypothesis testing n 30 , level of significance H 0 : 0 Step 1: Construct a vs. 1 100% and H a : 0 confidence interval As is known, x z 2 x z , x z 2 2 n n n As is unknown, x z Step 2: If 2 0 s x z 2 n s , x z 2 n s n falls into the above confidence intervals, then do not reject H 0 . Otherwise, reject H 0 . Example 1: The average starting salary of a college graduate is $19000 according to government’s report. The average salary of a random sample of 100 graduates is $18800. The standard error is 800. (a) Is the government’s report reliable as the level of significance is 0.05. (b) Find the p-value and test the hypothesis in (a) with the level of significance 0.01. (c) The other report by some institute indicates that the average salary is $18900. Construct a 95% confidence interval and test if this report is reliable. [solutions:] (a) H 0 : 0 19000 vs. H a : 0 19000, n 100, x 18800, s 800, 0.05 Then, 6 z x 0 18800 19000 2.5 2.5 z z 0.025 1.96 . s 800 2 n 100 Therefore, reject H 0 . (b) p - value P Z z P Z 2.5 2 PZ 2.5 0.0124 0.01 Therefore, not reject H 0 . (c) H 0 : 0 18900 vs H a : 0 18900, A 95% confidence interval is x z Since s n 2 18800 z 0.025 800 100 18800 1.96 80 18643.2, 18956.8 . 0 18900 18643.2, 18956.8 , Therefore, not reject H 0 . Example 2: A sample of 49 provides a sample mean of 38 and a sample standard deviation of 7. Let 0.05 . Please test the hypothesis H 0 : u 40 vs. H a : u 40 . based on (a) classical hypothesis test (b) p-value (c) confidence interval. [solution:] x 38, s 7, u 0 40, n 49, z x u 0 38 40 2 . s 7 n 49 (a) z 2 1.96 z 0.025 we reject H0 . 7 (b) p value P Z z P Z 2 2 * (1 0.9772) 0.0456 0.05 we reject H0 . (c) 100 (1 )% 95% confidence interval is x z Since s 2 n 38 z 0.025 7 49 38 1.96 36.04, 39.96. 40 36.04, 39.96, we reject H 0 . Online Exercise: Exercise 11.4.1 Exercise 11.4.2 8

