Motivation: A significant limitation of commercial fluorescence
advertisement
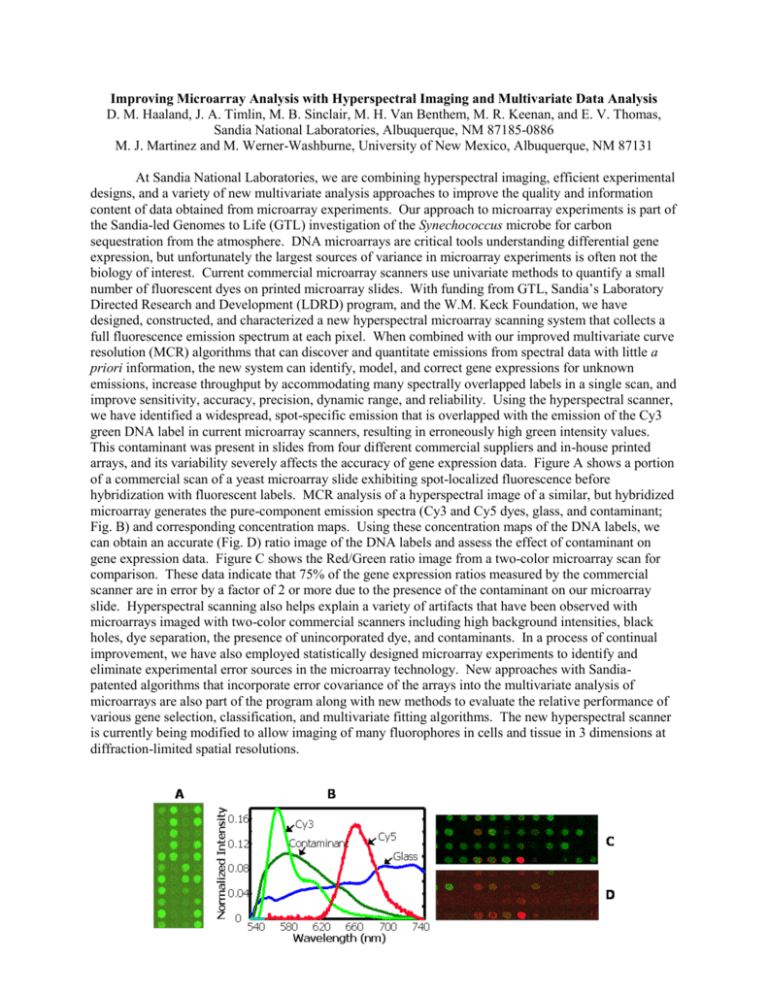
Improving Microarray Analysis with Hyperspectral Imaging and Multivariate Data Analysis D. M. Haaland, J. A. Timlin, M. B. Sinclair, M. H. Van Benthem, M. R. Keenan, and E. V. Thomas, Sandia National Laboratories, Albuquerque, NM 87185-0886 M. J. Martinez and M. Werner-Washburne, University of New Mexico, Albuquerque, NM 87131 At Sandia National Laboratories, we are combining hyperspectral imaging, efficient experimental designs, and a variety of new multivariate analysis approaches to improve the quality and information content of data obtained from microarray experiments. Our approach to microarray experiments is part of the Sandia-led Genomes to Life (GTL) investigation of the Synechococcus microbe for carbon sequestration from the atmosphere. DNA microarrays are critical tools understanding differential gene expression, but unfortunately the largest sources of variance in microarray experiments is often not the biology of interest. Current commercial microarray scanners use univariate methods to quantify a small number of fluorescent dyes on printed microarray slides. With funding from GTL, Sandia’s Laboratory Directed Research and Development (LDRD) program, and the W.M. Keck Foundation, we have designed, constructed, and characterized a new hyperspectral microarray scanning system that collects a full fluorescence emission spectrum at each pixel. When combined with our improved multivariate curve resolution (MCR) algorithms that can discover and quantitate emissions from spectral data with little a priori information, the new system can identify, model, and correct gene expressions for unknown emissions, increase throughput by accommodating many spectrally overlapped labels in a single scan, and improve sensitivity, accuracy, precision, dynamic range, and reliability. Using the hyperspectral scanner, we have identified a widespread, spot-specific emission that is overlapped with the emission of the Cy3 green DNA label in current microarray scanners, resulting in erroneously high green intensity values. This contaminant was present in slides from four different commercial suppliers and in-house printed arrays, and its variability severely affects the accuracy of gene expression data. Figure A shows a portion of a commercial scan of a yeast microarray slide exhibiting spot-localized fluorescence before hybridization with fluorescent labels. MCR analysis of a hyperspectral image of a similar, but hybridized microarray generates the pure-component emission spectra (Cy3 and Cy5 dyes, glass, and contaminant; Fig. B) and corresponding concentration maps. Using these concentration maps of the DNA labels, we can obtain an accurate (Fig. D) ratio image of the DNA labels and assess the effect of contaminant on gene expression data. Figure C shows the Red/Green ratio image from a two-color microarray scan for comparison. These data indicate that 75% of the gene expression ratios measured by the commercial scanner are in error by a factor of 2 or more due to the presence of the contaminant on our microarray slide. Hyperspectral scanning also helps explain a variety of artifacts that have been observed with microarrays imaged with two-color commercial scanners including high background intensities, black holes, dye separation, the presence of unincorporated dye, and contaminants. In a process of continual improvement, we have also employed statistically designed microarray experiments to identify and eliminate experimental error sources in the microarray technology. New approaches with Sandiapatented algorithms that incorporate error covariance of the arrays into the multivariate analysis of microarrays are also part of the program along with new methods to evaluate the relative performance of various gene selection, classification, and multivariate fitting algorithms. The new hyperspectral scanner is currently being modified to allow imaging of many fluorophores in cells and tissue in 3 dimensions at diffraction-limited spatial resolutions.

