Examples of SMART District Goals and Complete Plan Illustration
advertisement
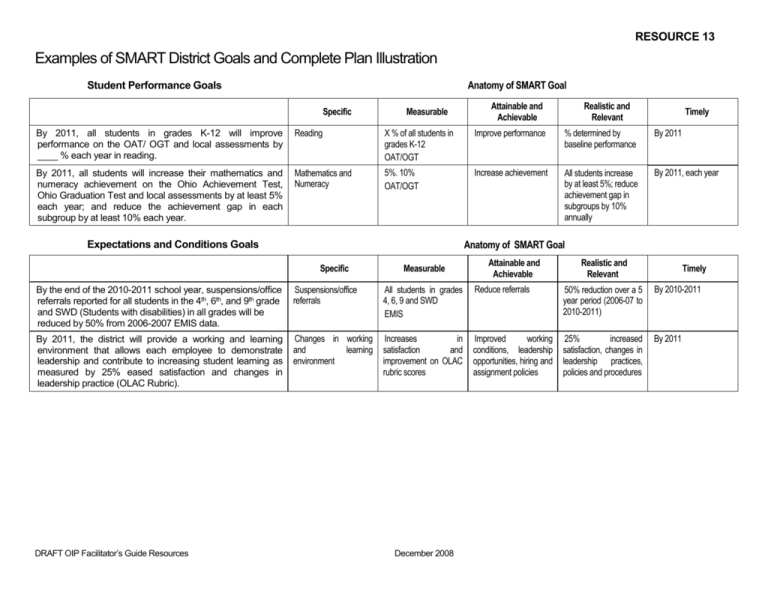
RESOURCE 13 Examples of SMART District Goals and Complete Plan Illustration Anatomy of SMART Goal Student Performance Goals Specific Measurable Attainable and Achievable Realistic and Relevant Timely By 2011, all students in grades K-12 will improve performance on the OAT/ OGT and local assessments by ____ % each year in reading. Reading X % of all students in grades K-12 OAT/OGT Improve performance % determined by baseline performance By 2011 By 2011, all students will increase their mathematics and numeracy achievement on the Ohio Achievement Test, Ohio Graduation Test and local assessments by at least 5% each year; and reduce the achievement gap in each subgroup by at least 10% each year. Mathematics and Numeracy 5%. 10% OAT/OGT Increase achievement All students increase by at least 5%; reduce achievement gap in subgroups by 10% annually By 2011, each year Anatomy of SMART Goal Expectations and Conditions Goals Specific Measurable Attainable and Achievable Realistic and Relevant Timely By the end of the 2010-2011 school year, suspensions/office referrals reported for all students in the 4th, 6th, and 9th grade and SWD (Students with disabilities) in all grades will be reduced by 50% from 2006-2007 EMIS data. Suspensions/office referrals All students in grades 4, 6, 9 and SWD EMIS Reduce referrals 50% reduction over a 5 year period (2006-07 to 2010-2011) By 2010-2011 By 2011, the district will provide a working and learning environment that allows each employee to demonstrate leadership and contribute to increasing student learning as measured by 25% eased satisfaction and changes in leadership practice (OLAC Rubric). Changes in working and learning environment Increases in satisfaction and improvement on OLAC rubric scores Improved working conditions, leadership opportunities, hiring and assignment policies 25% increased satisfaction, changes in leadership practices, policies and procedures By 2011 DRAFT OIP Facilitator’s Guide Resources December 2008 Tactful Local District Plan with Implementation Details DISTRICT PLAN IRN # 00000 SMART GOALS Goal 1: Student Performance Content Area: Reading Goal 2: Student Performance Content Area __________ Goal 3: Expectations & Conditions _____________ Goal 4: Operational/Cross-content-_________ GOAL 1: By 2011, all students in grades K-12 will improve performance on the OAT/OGT (Grades 3-8 and 10) and local summative assessments (Grades K-2, 9 and 11) by 8% each year in reading. STRATEGIES, INDICATORS AND PROGRESS MEASURES STRATEGY 1.A: Implement district identified research-based reading comprehension strategies (note taking, summarizing, and graphic organizers). BASELINE MEASURE ADULT IMPLEMENTATION INDICATOR 100% of teachers will consistently implement three research-based reading comprehension strategies: note taking, summarizing, and graphic organizers. May 2008 PROGRESS MEASURE ACTUAL DEC. 2008 RESULTS PROGRESS MEASURE ACTUAL MARCH 2009 RESULTS PROGRESS MEASURE ACTUAL MAY 2009 RESULTS 55% K-3 teachers 25% 4-8 teachers 20% 9-12 teachers 70% K-3 teachers 45% 4-8 teachers 40% 9-12 teachers 80% K-3 teachers 65% 4-8 teachers 60% 9-12 teachers 95% K-3 teachers 85% 4-8 teachers 80% 9-12 teachers 65% K-3 students on benchmark No baseline for 412, to be established in August. 2008 10% increase in # of students at benchmark 10% increase in # of students at benchmark 10% increase in # of students at benchmark PROGRESS MEASURE ACTUAL DEC. 2009 RESULTS 100% of teachers use strategies STUDENT PERFORMANCE INDICATOR 100% of students will be at benchmark on district required formative assessments. 100% or 10% increase in # of students at benchmark IMPLEMENTATION DETAILS ACTION STEPS 1. A.1. Provide embedded professional development for all building leadership teams on note taking and summarizing, reciprocal teaching and graphic organizers. DRAFT OIP Facilitator’s Guide Resources Monitoring Evidence/Data Sources Person(s) Responsible/ Group(s) PD Training, Classroom Observation Summaries District Teacher Leaders December 2008 Implementation Timeline SeptNov. Dec.Feb. MarchMay X X JuneAug. Resources Needed: Budget/Material/ Technology Training materials for 300 teachers Monitoring Evidence/Data Sources Person(s) Responsible/ Group(s) 1. A.2. Provide structures (e.g., grade level teams) and schedules (e.g., calendar, transportation) for professional development and collaboration among building teams. Schedules, District Procedures 1. A.3. Review curriculum documents to ensure that research-based reading strategies are emphasized in multiple disciplines. ACTION STEPS Implementation Timeline SeptNov. Dec.Feb. MarchMay Professional Development Director X X X Curriculum Analysis Curriculum Director X 1. A.4. Provide embedded professional development for building leaders on classroom observation and documentation of selected research-based strategies. PD Training, Onsite Observations Professional Development Director X 1. A.5. Analyze building level data from monthly classroom observations of use of research-based strategies. Classroom Observation Summaries District Data Team 1. A.6. Provide feedback to BLTs with additional support to buildings that do not meet progress measures including identification of specific mutually agreed upon actions that the BLT must take. Feedback reports – BLT actions District Leadership Team Chair X JuneAug. Resources Needed: Budget/Material/ Technology Training materials for 30 building administrators X X X X X X STRATEGY 1.B: Use quality benchmark assessments focused on reading comprehension to inform instruction and monitor student progress. BASELINE MEASURE ADULT IMPLEMENTATION INDICATOR 100% of teachers will use quality districtadopted formative reading comprehension assessments to inform instruction. May 2008 65% K-3 teachers 35% 4-8 teachers 10% 9-12 teachers use assessments PROGRESS MEASURE ACTUAL DEC. 2008 RESULTS 75% K-3 teachers 50% 4-8 teachers 20% 9-12 teachers PROGRESS MEASURE ACTUAL MARCH 2009 RESULTS 85% K-3 teachers 65% 4-8 teachers 40% 9-12 teachers STUDENT PERFORMANCE INDICATOR 100% of students will be at benchmark on district required formative assessments DRAFT OIP Facilitator’s Guide Resources See Strategy 1 A December 2008 PROGRESS MEASURE ACTUAL MAY 2009 RESULTS 95% K-3 teachers 80% 4-8 teachers 60% 9-12 teachers PROGRESS MEASURE ACTUAL DEC. 2009 RESULTS 100% of teachers use assessments IMPLEMENTATION DETAILS Implementation Timeline Monitoring Evidence/Data Sources Person(s) Responsible/ Group(s) 1. B.1. Communicate the district assessment system so it clearly defines and articulates summative and formative assessment instruments, purposes, uses, scheduling and reporting and monitoring expectations. Written assessment system Assessment Director X 1. B.2. Review, and revise as appropriate, current district formative assessments to ensure they meet quality criteria, and coach teacher leaders in using these quality assessments focused on reading comprehension. Evaluation of Assessments & Coaching Log Analysis Assessment Director/ District Data Team X 1. B.3. Provide embedded professional development for all building leadership teams on the use of formative district reading comprehension assessments. PD Training, Classroom Observation Summaries District Teacher Leaders 1. B.4. Provide structures (e.g., data teams) and schedules (calendar, transportation) for professional development and collaboration among building leadership teams. Schedules, District Procedures Professional Development Director 1. B.5. Analyze formative assessment results by building, grade level and subgroups to target resources and school technical assistance. Online assessment results District Data Team 1. B.6. Work with parent and community leaders to understand assessment results and identify district-wide reading efforts that will build comprehension. Meeting Summaries & Decisions District Leadership Team ACTION STEPS DRAFT OIP Facilitator’s Guide Resources December 2008 SeptNov. X X Dec.Feb. MarchMay JuneAug. Resources Needed: Budget/Material/ Technology Contract for consultant to facilitate review and revision process Training materials for 300 teachers X X X X X X X License, software & hardware for online assessments/ analysis X X X Community-parent friendly data reports. SMART GOALS Goal 1: Student Performance Content Area : Goal 2: Student Performance Content Area : Math Goal 3: Expectations & Conditions ____________ _ Goal 4: Operational/Cross-content-____________ GOAL 2: By the end of the 2010-11 school year, all students in grades 3-12 will improve performance on the OAT/OGT (Grades 3-8 and 10) and local summative assessments (Grades 9 and 11) by 10% each year in mathematics. STRATEGIES, INDICATORS AND PROGRESS MEASURES (PROJECTED AND ACTUAL) STRATEGY 2.A: Implement the standards-based district curricula in mathematics. BASELINE MEASURE Adult Implementation Indicator September 2008 100% of teachers will consistently implement mathematics power standards and district curriculum guides as measured by classroom observations. Student Performance Indicator 55% K-3 teachers 25% 4-5 teachers 60% 6-8 math teachers 50% 9-12 math teachers May 2008 100% of students will be on grade-level as measured by math formative assessments. 3rd 6th 60% & grade 50% 4th & 8th grade 38% 5th & 7th grade 65% 9th – 11th grade PROGRESS MEASURE FEB. 2009 ACTUAL 70% K-3 teachers 45% 4-5 teachers 70% 6-8 teachers 75% 9-12 teachers MAY 2009 PROGRESS MEASURE ACTUAL NOV. 2009 80% K-3 teachers 65% 4-5 teachers 80% 6-8 teachers 100% math teachers FEB. 2009 MAY 2009 3rd 3rd 3rd 70% & 6th grade 60% 4th & 8th grade 50% 5th & 7th grade 75% 9th – 11th grade 2. A.1. Collect data on and monitor the degree to which standards, curriculum guides and adopted curriculum materials are implemented, focusing on buildings below the 50% cut and grades 4th-8th. 80% & 6th grade 70% 4th & 8th grade 60% 5th & 7th grade 85% 9th – 11th grade Monitoring Evidence/Data Sources Person(s) Responsible/ Group(s) Classroom observation summaries, building data District Data Team & AssessmentTech. Director December 2008 ACTUAL 95% K-3 teachers 85% 4-5 teachers 100% 6-8 teachers NOV. 2008 ACTION STEPS DRAFT OIP Facilitator’s Guide Resources PROGRESS MEASURE 100% of teachers implement curriculum as designed FEBRUARY 2010 90% & 6th grade 80% 4th & 8th grade 75% 5th & 7th grade 90% 9th – 11th grade 100% of all students Implementation Timeline SeptNov. Dec.Feb. MarchMay X X X PROGRESS MEASURE JANUARY 2010 JuneAug. Resources Needed: Budget/Material/ Technology Site license Common observation protocol Implementation Timeline Monitoring Evidence/Data Sources Person(s) Responsible/ Group(s) 2. A.2. Provide job-embedded training and in-building support for all special education and ESL teachers on how to make accommodations so all students have full access to the district core adopted curriculum. PD materials & feedback, Observations Special Education Director 2. A.3. Promote and support the systematic use of the Lesson Plan Template for mathematics (aligned with Ohio mathematics content standards and district curriculum). Classroom observations linked to approved written plans Math Teacher Leaders 2. A.4. Offer peer supported professional development for teachers during the summer (initial) who do not demonstrate implementation of curriculum and/or instructional strategies (followed throughout the year). Attendance records, Classroom observations Curriculum-PD Director X X 2.A.5 Require full implementation of the district adopted mathematics program at least 60 minutes per day in all K-8 classrooms Principal Evaluations Supt. X X 2.A.6 Create classroom and family friendly curriculum materials for students, families and community about standards and curriculum expectations, including strategies for embedding math across the content areas Customer Satisfaction Survey Curriculum – PD & Technology Directors X X 2.A.7 Ensure intervention options offered at each school meets quality criteria and serves students in greatest need Review of intervention designs, participation rates compared to assessment results District Data Team X ACTION STEPS DRAFT OIP Facilitator’s Guide Resources December 2008 SeptNov. Dec.Feb. MarchMay JuneAug. Resources Needed: Budget/Material/ Technology Training materials for 2 ESL and 16 Sp. Ed. Teachers X X X Duplication of lesson plan templates X X Release time for peer teacher mentors and mentees, summer stipends, materials & supplies X X X Release time for committees X STRATEGY 2.B: Implement two research-based instructional strategies (generating and testing hypotheses and higher level questioning). Adult Implementation Indicator BASELINE MEASURE September 2008 100% of teachers will consistently implement two research-based strategies: generating and testing hypotheses and using higher level questions as measured by classroom observations and student work samples. 25% K-3 teachers 10% 4-5 teachers 20% 6-8 teachers 12.5% 9-12 teacher (6-12 math only) Student Performance Indicator May 2008 100% of students will score at a proficient level on protocols/rubrics to assess if students can generate and test hypotheses and use/respond to higher level questions. 10% K-3 students 5% 4-5 students 10% 6-8 students 15% 9-12 students (6-12 math only) PROGRESS MEASURE FEB. 2009 ACTUAL 70% K-3 teachers 35% 4-5 teachers 40% 6-8 teachers 25% 9-12 teachers PROGRESS MEASURE MAY 2009 ACTUAL 80% K-3 teachers 65% 4-5 teachers 60% 6-8 teachers 50% 9-12 teachers NOV. 2008 ACTUAL Increase by 25% FEB. 2009 PROGRESS MEASURE NOV. 2009 ACTUAL 95% K-3 teachers 85% 4-5 teachers 80% 6-8 teachers 100% 9-12 teachers ACTUAL 100% of teachers consistently use strategies MAY 2009 ACTUAL Increase by 50% Increase by 75% Monitoring Evidence/Data Sources Person(s) Responsible/ Group(s) Implementation Timeline Unexcused attendance & tutoring data compared to assessment data 2. B.2. Provide job-embedded training for all mathematics teacher leaders on how to implement the instructional strategies of generating and testing hypotheses and higher level questioning using grade appropriate techniques that maximize student engagement. 2. B.3. Put into full practice protocols/rubrics to assess student work for determining if students can generate and test hypotheses and use/respond to higher level questions. ACTION STEPS 2. B.1. Employ student peer mentor program to increase attendance in 6th – 12th grade math classes and/or tutor students who are below grade level in mathematics. DRAFT OIP Facilitator’s Guide Resources SeptNov. Dec.Feb. MarchMay Pupil Personnel Services Director X X X PD materials, observations of math teacher leaders Curriculum – PD Director X X X Student work sample and scoring results Math Teacher Leaders December 2008 X X PROGRESS MEASURE JANUARY 2010 X FEBRUARY 2010 100% of all students JuneAug. Resources Needed: Budget/Material/ Technology Student peer mentor incentives X Training materials, summer stipends Monitoring Evidence/Data Sources Person(s) Responsible/ Group(s) 2. B.4. Support school-based implementation of mathematics standards and practices, e.g., study groups, grade level cluster meetings, based on SIPs through highly skilled math teacher leaders. Math Teacher Leader Logs Curriculum - PD Director 2. B.5. Collect data on and monitor the degree to which instructional strategies are implemented in all classrooms. Classroom observation summaries, student work samples District Data Team ACTION STEPS Implementation Timeline SeptNov. X X Dec.Feb. MarchMay X X X X JuneAug. Note: The DLT will analyze data on a quarterly basis and adjustments as necessary to the district actions, timelines and/or persons responsible. DRAFT OIP Facilitator’s Guide Resources December 2008 X Resources Needed: Budget/Material/ Technology Salaries & fringe benefits for math teacher leaders, training materials for math teacher leaders Common observation protocol TACTFUL LOCAL DISTRICT COMMUNICATION APPROACH WHEN TO WHOM BY WHOM Sept. Tech. Dir. X X X X May Asst. Supt. X X X X August Tech. Dir. Solicit feedback on plan goals, strategies, indicators May Asst. Supt. X Report plan progress (goal and strategy indicators) Work with organizations/partners to understand importance and use of assessments and assessment results Create collaboratively supported community wide reading efforts consistent with district goals and strategies Report student performance & classroom practice changes across the district and by building Explain changes to curriculum & benchmark assessments and expectations/requirements for use consistently in all classrooms Describe professional development schedule, content, process to allow maximum participation Solicit feedback on district capacity to implement plan Work to coordinate professional development to ensure focus, consistency and balance Collect monthly observation & formative assessment results Review analysis of building level data on performance and implementation indicators, e.g. use of strategies Community Members, Organizations & Partners Jan. & June Tech. Dir. X Feb. -- May Asst. Supt. Oct. – Jan. Lit. Coordinator X Sept., Dec., March, May Asst. Supt. X All District Employees Dec. Curriculum Dir. Monthly Building Leadership Teams Report plan progress (goal and strategy indicators) Solicit approval for changes in policy and/or procedures necessary to implement plan Adopt plan (and mid-course corrections as appropriate) for district implementation DRAFT OIP Facilitator’s Guide Resources Board of Education Meetings CD, DVD, Simulcast, Webinaire Presentations Families (English & Spanish Print Material Written Reports Describe plan goals, strategies, actions Report student performance & classroom practice changes across the district and by building Revise district answering message to describe plan goals Internet Intranet TV & Radio Telephone HOW (MEANS OF COMMUNICATION) Print Media WHAT (WILL BE COMMUNICATED) X X X X X X X X X X PD Dir. X X Jan., April Asst. Supt. X Aug., Jan. PD Dir. Monthly Curriculum Dir. Nov., Feb., April Data Team Nov., Jan., Mar., June Supt. June (or as needed) Supt. X June (or as needed) Supt. X December 2008 X X X X X X X X X X X X X X TACTFUL LOCAL DISTRICT PLAN EVALUATION PROCESS Purpose(s): The overall purpose of the district plan evaluation is to determine if implementation of the strategies, actions and associated resources result in increased student achievement as specified in the district goals (i.e., improved performance on the OAT/OGT and local assessments by 8% is a summative assessment used to understand whether the goal has been met). The evaluation or summative assessment documents achievement of district goals. Audiences: The evaluation results will be shared with the Board of Education in detail at a designated board meeting and a summary of the evaluation with parents, community members, organizations, partners, and all district employees using the internet and intranet. Responsibility: The Director of Assessment and Director of Professional Development will share responsibility for the implementation of the evaluation, including the organization and scheduling of building level observations. The District Leadership Team will assume responsibility for the analysis of the evaluation data. The Superintendent will assume responsibility for reporting evaluation findings. Timeline: The analysis for the summative evaluation will occur from early August – mid-September with final reporting occurring in October. Resources: There are no anticipated budget costs. Two teachers working on their doctorate will assist with collecting, coding and summarizing data at no cost to the district. Questions: The evaluation of the district plan will provide answers to the following: 1) 2) 3) 4) 5) How do planned results compare to actual outcomes in student performance? What is the impact of professional development on teacher practice and student achievement? Has our district plan been implemented with integrity, on-time and within budget? What lessons has the district learned as a result of implementing this plan (and how will they be applied to the next plan)? What should the district do to institutionalize successes and eliminate unsuccessful practices? Methods, Instrumentation and Sampling: The following procedures will be applied: 1) Data other than student achievement will be recorded and collected using district developed reporting instruments, e.g., observation recording logs, data reporting format. 2) A comparison of building and district sponsored/supported professional development participation (attendance records, coaching logs - services to individual teachers, and district administration observation reports) to classroom student performance results will be made. 3) Formative assessment results will be recorded on a summary form provided by the district. Where possible, formative assessment results will be compared to summative results, i.e., OAT/OGT results by grade, building, subgroup, content and sub-skill areas (per plan). 4) DLT members will observe each building on a quarterly basis, randomly selecting classrooms, using a consistent recording form. 5) The DLT will analyze the building level data on use of strategies and formative assessments, comparing the results to their observations. 6) All Building and District Leadership Teams will re-administer the Leadership Practices assessment (comparison of baseline and end-of-year). 7) The DLT will complete a mini-Decision Framework (essential questions directly related to the district goals, strategies, and actions). 8) All data will be summarized and organized by evaluation question for DLT analysis. 9) DLT will analyze data in order to answer the five evaluation questions during a special meeting of the DLT called by the Superintendent. DRAFT OIP Facilitator’s Guide Resources December 2008 Tactful Local “C Elementary” School Improvement Plan with Implementation Details DISTRICT GOALS/STRATEGIES/INDICATORS DISTRICT NAME/IRN# SCHOOL NAME SMART GOALS Goal 1: Student Performance Content Area : Reading Goal 2: Student Performance Content Area __________ Goal 3: Expectations & Conditions _____________ Goal 4: Operational/Cross-content-_________ GOAL 1: By 2011, all students in grades K-12 will improve performance on the OAT/OGT (Grades 3-8 and 10) and local summative assessments (Grades K-2, 9 and 11) by 8% each year in reading. STRATEGIES, INDICATORS AND PROGRESS MEASURES STRATEGY 1.A: Implement district identified research-based reading comprehension strategies (note taking, summarizing, and graphic organizers). BASELINE MEASURE PROGRESS MEASURE ACTUAL DEC. 2008 DATA May 2008 ADULT IMPLEMENTA TION INDICATOR 100% of teachers will consistently implement three research-based reading comprehension strategies: note taking, summarizing, and graphic organizers. District School DIST. 55% K-3 25% 4-5 6 of 11 K-3 teachers 1 of 4 4-5 teachers 70% K-3, 45% 4-5 65% K-3 students on benchmark, No baseline for 4-5, to be established in August. 2008 45% of K-3 students No baseline for 4-5, to be established in August 2008 10% increase in # of students at benchmark SCH. K-3: 8 of 11 4-5: 2 of 4 PROGRESS MEASURE ACTUAL MARCH 2009 DATA DIST. SCH. K-3: 9 of 11 4-5: 3 of 4 80% K-3, 65% 4-5 PROGRESS MEASURE ACTUAL MAY 2009 DATA DIST. 95% K-3, 85% 4-5 SCH. 100% of teachers PROGRESS MEASURE ACTUAL DEC. 2009 DATA DIST. SCH. 100% STUDENT PERFORMANCE INDICATOR 100% of students will be at benchmark on district required formative assessments. DRAFT OIP Facilitator’s Guide Resources 60% of K3 students; TBD for 4-5 10% increase in # of students at benchmark 75% of K-3 students; TBD for 4-5 December 2008 10% increase in # of students at benchmark 90% of K-3 students; TBD for 4-5 100% or 10% increase in # of students at benchmark 100% of K-3 students, TBD for 4-5 IMPLEMENTATION DETAILS Person(s) Responsible/ Group(s) 1. A.1. Provide job-embedded professional development for all teachers on note taking and summarizing and graphic organizers including the use of instructional technology to support them and one grade-level research based comprehension strategy. Coaching log Literacy Coach 1. A.2. Implement note taking and summarizing and graphic organizers weekly in every classroom. Classroom observations Principal & Assistant Principal 1. A.3. Provide training to parents and families on techniques for reinforcing the reading comprehension. PD agenda, materials, evaluation results Parent Liaison 1. A.4. Conduct home visits and/or conferences for all students who are not proficient in reading comprehension to provide ideas to parents, set-up simple at-home techniques for the parents. Schedule & decisions (submitted to principal) Parent Liaison & Appropriate Teacher 1. A.5. Meet bi-weekly to review strategies, assessment results and make revisions as necessary. Grade Level Reports (to principal) Grade Level Leaders 1. A.6. Evaluate the impact of the reading comprehension action steps school wide in terms of adult implementation and student results and report modifications and next steps to the DLT. Overall progress report Building Leadership Team ACTION STEPS DRAFT OIP Facilitator’s Guide Resources December 2008 Implementation Timeline August Sept. October Nov. Dec. January Feb. March April May June July Monitoring Evidence/Data Sources Technology hardware & software X X X X X X X X X Classroom materials and supplies X X X X X X X X X X X Resources Needed: Budget/Material/ Technology PD materials and supplies X Mileage reimbursement X X X X X Parent materials X X X X X X X X X X X X X X STRATEGIES, INDICATORS AND PROGRESS MEASURES STRATEGY 1.B: Use quality benchmark assessments focused on reading comprehension to inform instruction and monitor student progress. BASELINE MEASURE PROGRESS MEASURE ACTUAL DEC. 2008 DATA May 2008 ADULT IMPLEMENTATION INDICATOR 100% of teachers will use quality district-adopted formative reading comprehension assessments to inform instruction. District 65% K-3 teachers 35% 4-5 teachers School 6 of 11 K-3 1 of 4 4-5 DIST. 70% K-3, 45% 4-5 PROGRESS MEASURE ACTUAL MARCH 2009 DATA SCH. DIST. 80% K-3, 65% 4-5 K-3: 8 of 11 4-5: 2 of 4 PROGRESS MEASURE ACTUAL MAY 2009 DATA SCH. DIST. 95% K-3, 85% 4-5 K-3: 9 of 11 4-5: 3 of 4 PROGRESS MEASURE ACTUAL DEC. 2009 DATA SCH. DIST. 100% of teachers 100% SCH. STUDENT PERFORMANCE INDICATOR 100% of students will be at benchmark on district required formative assessments. See 1.A. IMPLEMENTATION DETAILS Implementation Timeline Person(s) Responsible/ Group(s) 1. B.1. Create common planning time for all teachers to learn how to appropriately administer and use district formative assessments to guide instruction. Schedule Building Leadership Team X 1. B.2. Prepare a cross grade level team to collect and analyze building assessment results and methods for coaching grade level teams. PD agenda, materials, evaluation results Assistant Principal X X 1. B.3. Provide technical assistance to grade level teams in administering and using formative assessment data. Schedule & reports Building Leadership Team ACTION STEPS DRAFT OIP Facilitator’s Guide Resources December 2008 August Sept. October Nov. Dec. January Feb. March April May June July Monitoring Evidence/Data Sources X X X X X X X X X X Resources Needed: Budget/Material/ Technology Stipends and subs, PD materials ACTION STEPS Person(s) Responsible/ Group(s) Implementation Timeline August Sept. October Nov. Dec. January Feb. March April May June July Monitoring Evidence/Data Sources Resources Needed: Budget/Material/ Technology Paper and supplies 1. B.4. Conduct quarterly grade level meetings (each grade level to determine the most appropriate method) to explain to all parents/families what his/her child will be expected to know and be able to do, how learning will be assessed, and where the child is in relation to the expectations. Agenda, meeting summary Grade Level Leaders 1. B.5. Meet bi-weekly to review strategies, assessment results and make revisions as necessary. Grade Level Reports (to principal) Grade Level Leaders 1. B.6. Monitor the effectiveness of grade level teams and the use of common formative assessments by all teachers to inform their instruction, reporting results to the DLT. Overall progress report Building Leadership Team X X X X Copy machine/ink cartridges X X X X X X X X X X X X X X SMART GOALS Goal 1: Student Performance Content Area : Goal 2: Student Performance Content Area : Math Goal 3: Expectations & Conditions ____________ _ Goal 4: Operational/Cross-content-____________ GOAL 2: By the end of the 2010-11 school year, all students in grades 3-12 will improve performance on the OAT/OGT (Grades 3-8 and 10) and local summative assessments (Grades 9 and 11) by 10% each year in mathematics. STRATEGIES, INDICATORS AND PROGRESS MEASURES (PROJECTED AND ACTUAL) STRATEGY 2A: Implement the standards-based district curricula in mathematics. BASELINE MEASURE PROGRESS MEASURE ACTUAL FEB. 2009 DATA September 2008 ADULT IMPLEMENTATION INDICATOR 100% of teachers will consistently implement math priority standards and district curriculum guides as measured by classroom observations. District School 55% K-3 teachers 25% 4-5 teachers 6 of 11 K-3 teachers 1 of 4 4-5 teachers DRAFT OIP Facilitator’s Guide Resources DIST. 70% K-3 45% 4-5 SCH. 8 of 11 2 of 4 PROGRESS MEASURE ACTUAL MAY 2009 DATA DIST. 80% K-3 65% 4-5 SCH. 9 of 11 3 of 4 December 2008 PROGRESS MEASURE ACTUAL NOVEMBER 2009 DATA DIST. 95% K-3 85% 4-5 SCH. PROGRESS MEASURE ACTUAL JANUARY 2010 DATA DIST. SCH. 100% 100% 11 of 11 4 of 4 STUDENT PERFORMANCE INDICATOR 100% of students will be on grade-level as measured by math formative assessments. May 2008 NOV. 2008 60% 3rd 50% 4th 38% 5th 65% 3rd 45% 4th 42% 5th 70% 3rd 60% 4th 50% 5th FEB. 2009 70% 3rd 70% 4th 50% 5th 80% 3rd 70% 4th 60% 5th 80% 3rd 80% 4th 60% 5th MAY 2009 90% 3rd 80% 4th 75% 5th 90% 3rd 80% 4th 75% 5th FEB. 2009 100% 100% IMPLEMENTATION DETAILS Implementation Timeline Person(s) Responsible/ Group(s) 2. A.1 Collect data on and monitor the degree to which standards, curriculum guides and adopted curriculum materials are implemented in all classrooms. Monthly observation data Principal X X X X X X X X X 2. A.2 Collaboratively develop weekly mathematics lessons using the district Lesson Plan Template and meet quarterly in grade level groups to look at the data and discuss the use of strategies. Weekly reviewed lesson plans Grade Level Teacher Leaders & Principal X X X X X X XX X Building and class schedules Teacher evaluations Principal X X XX X X X XX X Formative assessment results for participating students Intermediate Grade Level Teacher Leaders Formative assessment results Special Education Teacher ACTION STEPS 2.A.3 Require full implementation of the district adopted mathematics program at least 60 minutes per day in all classrooms for every student 2.A.4 Offer district approved Saturday Academy for students in grades 3-5 who are one or more performance levels below grade level on the district formative assessment, focusing on standards and curriculum associated with numbers-number sense, measurement and geometry 2. A.5 Pair student mentor with individual students with disabilities who are below grade level in mathematics to provide tutoring after school. DRAFT OIP Facilitator’s Guide Resources December 2008 August Sept. October Nov. Dec. January Feb. March April May June July Monitoring Evidence/Data Sources X X X X X X X X X X X X X X X X X Resources Needed: Budget/Material/ Technology District observation protocol Teacher stipends, supplies Incentives for student mentors STRATEGY 2.B: Implement two research-based instructional strategies (generating and testing hypotheses and higher level questioning). BASELINE MEASURE September 2008 ADULT INDICATOR IMPLEMENTATION 100% of teachers will consistently implement two research-based strategies: generating and testing hypotheses and using higher level questions as measured by classroom observations and student work samples. STUDENT PERFORMANCE INDICATOR 100% of students will score at a proficient level on protocols/rubrics to assess if students can generate and test hypotheses and use/respond to higher level questions. District School 25% K-3 teachers 10% 4-5 teachers 3 of 11 K-3 teachers 1 of 4 4-5 teachers May 2008 10% K-3 students 5% 4-5 students DRAFT OIP Facilitator’s Guide Resources 20% K-3 15% 4-5 PROGRESS MEASURE ACTUAL FEB. 2009 DATA DIST. 70% K-3 45% 4-5 SCH. 8 of 11 2 of 4 NOV. 2008 Increase by 25% 25% K-3 19% 4-5 PROGRESS MEASURE ACTUAL MAY 2009 DATA DIST. 80% K3 65% 45 SCH. 9 of 11 3 of 4 FEB. 2009 Increase by 50% 38% K-3 29% 4-5 December 2008 PROGRESS MEASURE ACTUAL NOV. 2009 DATA DIST. 95% K-3 85% 4-5 SCH. DIST. SCH. 100% 100% MAY 2009 Increase by 75% PROGRESS MEASURE ACTUAL JANUARY 2010 DATA 67% K-3 51% 4-5 FEB. 2010 100% 100% IMPLEMENTATION DETAILS 2. B.1. Provide professional development from selected lessons in Powerful Practices in Mathematics on numbers- number sense and geometry that reinforce the instructional strategies of generating and testing hypotheses once every other month during grade level meetings. Observations of lessons & strategies Math Teacher Leader X X X X X X X X X 2. B.2. Assess student work with district developed protocols/rubrics to determine if students use/respond to higher level questions through bi-monthly study groups facilitated by the math teacher leader. Student work samples results by classroom Grade Level Teacher Leaders X 2. B.3. Teach students to assess their own work using the district developed rubric. Student work samples Grade Level Teacher Leaders X X X 2. B.4. Support students to develop self-assessment skills and their ability to regulate their learning by adjusting strategies to include questions that prompt students to reflect on their own learning and assist students to develop internal monitoring systems. Student work samples Grade Level Teacher Leaders X X X 2. B.5. Analyze and report to the principal and the BLT at the end of each quarter the student work sample results. Quarterly results Building Data Team 2. B.6. Conduct fall, winter and spring Family Math Night and Saturdays where families learn techniques to support math achievement at home, e.g., family math games, and discuss progress of children to include supplying grade level packets for use at home. Satisfaction Survey Results Math teacher leader with grade level leaders X 2. B.7. Collect data on and monitor the degree to which instructional strategies is implemented in all classrooms consistent with knowledge/skills learned during professional development (application-impact of PD). Monthly observation data Principal X X X X X X X X X ACTION STEPS DRAFT OIP Facilitator’s Guide Resources December 2008 August Sept. October Nov. Dec. January Feb. March April May June Person(s) Responsible/ Group(s) X X X X X X X July Implementation Timeline Monitoring Evidence/Data Sources Resources Needed: Budget/Material/ Technology District developed protocols/rubrics X X Calculators for parents District developed materials District observation protocol TACTFUL LOCAL “C ELEMENTARY” SCHOOL COMMUNICATION APPROACH Report student performance & classroom practice changes by grade levels on hotline and email Solicit feedback and support for plan actions Publicize school calendar to include important dates, events, tips on supporting comprehension at home Inform parents of schedule changes, grade level expectations and rationale for collaborative planning time Explain importance of creating positive learning environment at home, especially during assessment week Print district goals, strategies and building actions on Piggy Wiggly grocery bags and Emily’s Restaurant place mats Speak to the wider community about standards, expectations for learning, student, parent and community responsibilities for increasing student learning Convey plan contents and progress at PTSA, Chamber of Commerce, Lions Club and Tactful Community Bank (business partner) meetings Students & Families (English & Spanish Community & Business Partners Report student performance & classroom practice changes during staff meetings Explain changes to curriculum & benchmark assessments and expectations/requirements for use consistently in all classrooms Describe professional development schedule, content, process to allow maximum participation Solicit feedback on school capacity to implement plan Work to coordinate professional development to ensure focus, consistency and balance Submit monthly observation & formative assessment results DRAFT OIP Facilitator’s Guide Resources All Building Employees District Leadership Team X Meetings X Jan. & May Principal September BLT Chair Monthly Secretary Oct., Jan., March, May Grade level team leaders Quarterly Counselor October Counselor Schedule with local radio station Student Council Schedule with organizations BLT Members Quarterly BLT Members X August Orientation BLT Members X September Principal X X Jan., May BLT X X Aug., Jan. BLT Monthly Principal December 2008 X Presentations HOW (MEANS OF COMMUNICATION) Written Reports BY WHOM Telephone WHEN Print Material TO WHOM Print Media Internet Intranet TV & Radio WHAT (WILL BE COMMUNICATED) X X X X X X X X X X X X X X X X TACTFUL LOCAL “C ELEMENTARY” SCHOOL EVALUATION PROCESS Purpose(s): The overall purpose of the school plan evaluation is to determine if implementation of the actions and associated resources result in increased student achievement as specified in the district goals (i.e., improved performance on the OAT/OGT and local assessments by 8%) and indicators. Audiences: The evaluation results will be shared by the BLT with the Superintendent in detail and a summary with parents, partner organizations, and all building employees. Questions: The evaluation of the school plan will provide answers to the following: 1. How do planned results compare to actual outcomes in student performance? 2. What is the impact of professional development on teacher practice and student achievement? 3. Has our school plan been implemented with integrity, on-time and within budget? 4. What lessons has the school learned as a result of implementing this plan (and how will they be applied to the next plan)? 5. What should the building do to institutionalize successes and eliminate unsuccessful practices? METHOD/PROCEDURE Collect data other than student achievement and record using district developed reporting instruments. Schedule mutually developed. INSTRUMENTATION Coaching log Observation format SAMPLE All classrooms RESPONSIBILITY Literacy Coach Principal TIMELINE Monthly Compare professional development participation (attendance records, coaching logs - services to individual teachers, and building administration observation reports) to classroom student performance results. Observation and coaching logs PD participation records Formative assessments All teachers School PD All students Assistant Principal Quarterly Record formative assessment results on a summary form provided by the district. Formative assessment results All students Grade level leaders Every 6 weeks Analyze classroom level data on use of strategies and formative assessments, comparing results to observations. Feedback will be provided to individual teachers/grade level groups. Teachers that do not meet progress measures will be provided additional support from the coach. Reporting and feedback formats BLT Quarterly BLT As needed Make adjustments as necessary to the building actions, timelines and/or persons responsible based on a review of the quarterly analysis. Re-administer the Leadership Practices assessment. Leadership Practices On-line Assessment BLT (baseline and end-of-year) BLT April Complete a mini-Decision Framework (essential questions directly related to the building strategies and actions). KRAL, OAT results (multiple years) Decision Framework All students Entire BLT Principal April Summarize and organize data by evaluation question for BLT analysis and interpretation. BLT Co-Chairs May Answer the five evaluation questions during a special BLT meeting after receiving the current years OAT/OGT results. BLT Early Aug.mid Sept. DRAFT OIP Facilitator’s Guide Resources December 2008 DRAFT OIP Facilitator’s Guide Resources December 2008
