Document
advertisement
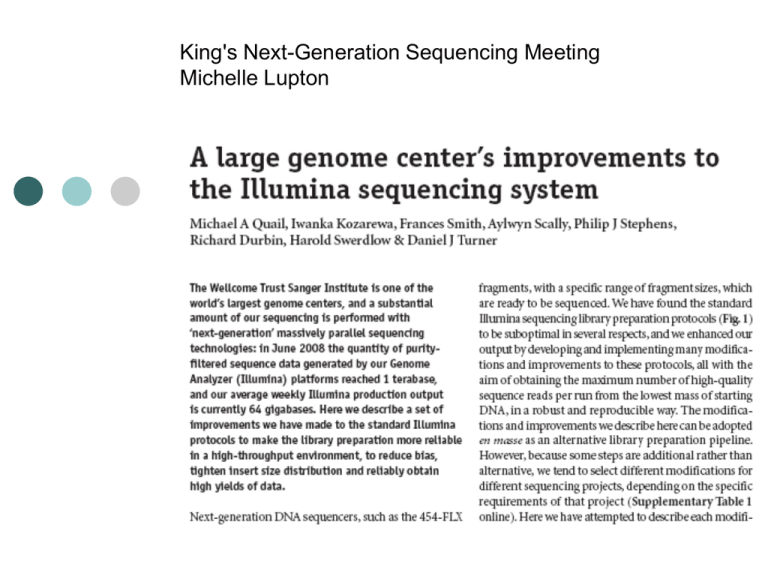
King's Next-Generation Sequencing Meeting Michelle Lupton Additional references Linnarsson S. Recent advances in DNA sequencing methods - general principles of sample preparation. Exp Cell Res. 2010 May 1;316(8):1339-43. Epub 2010 Mar 6. Review. PubMed PMID: 20211618. Buehler B, Hogrefe HH, Scott G, Ravi H, Pabón-Peña C, O'Brien S, Formosa R, Happe S. Rapid quantification of DNA libraries for next-generation sequencing. Methods. 2010 Apr;50(4):S15-8. Review. PubMed PMID: 20215015.-the use of real time PCR Stages in the library preparation Steps accompanied by numbers are those for which we suggest alternatives to the standard Illumina protocols. Numbers correspond to those given in Supplementary Protocols Fragmentation Nebulization Uneconomical distribution of fragment size. Approximately half of the DNA vaporises Adaptive Focused acoustics – Covaris Acoustic energy is controllably focused into the aqueous DNA sample by a dish-shaped transducer, resulting in cavitatin events within the sample. 17% of the sample is in the 200bp size range, and little DNA loss Fragmentation Enzymatic digestion (Linnarsson 2010) Two recent commercial enzymatic fragmentation kits were introduced. Fragmentase (New England Biolabs) - based on V.vulnificus nuclease that generates random nicks, and modified T7 endonuclease that recognises the nicks and cleaves the opposite strands. Nextera (Epicentre) - based on random transposon insertion. Also introduces adapter sequences simultaneously with fragmentation. A-tailing, ligation and size selection Artefacts from standard library prep; 1. 3. Bias in base composition High frequency of chimeric sequences Imperfect insert size distribution Overcome by; 1. Pair-end oligos Gel extraction-melt slice at room temp-reduces GC bias Improved efficiency of the end repair and A-tailing Double size selection Paired end size selection-only excise a 2mm size gel slice 2. 2. 3. 4. 5. Figure 3 A-tailing, ligation and size selection GC plots before (a) and after (b) optimisation of gel extraction. The figures show the total area in which reads with a particular GC content are distributed, with the mean and standard deviation. The greater width of shaded area in plot a) indicates a wider dispersion of coverage for all values of GC content for which sequences were obtained. Agilent traces Bioanalyzer 2100 traces for two suboptimal libraries c) 60bp insert library, with optimised PCR, d) the same 60bp library with excess DNA in PCR e) 200bp insert library, showing shoulder of small fragments. Insert size distribution from sequenced human DNA using f) the standard and g) modified paired end library prep protocols PCR Template quality -use optimized quantities of DNA template. Use of high fidelity polymerases in an optimised reaction. Use of solid phase reversible immobilization SPRI technology (SPRI) removes a higher proportion of primers and adapter dimers than spin columns. Reduce the number of PCR cycles: 3ng DNA and 14 cycles of PCR amplification for single end libraries, 25ng DNA and 12 cycles for high complexity libraries, and 10ng DNA and 18 cycles for lower complexity samples. These quantities give the optimal compromise between clean libraries and a low frequency of duplicate sequences. Possible to eliminate the PCR step by ligating on appropriate adaptors after Atailing. Direct sequencing of short amplicons. Figure 4 PCR a) A ~200bp fragment library was prepared, and 10ng was amplified for 18 cycles using standard Illumina conditions, and with more optimal PCR conditions. b) After PCR we divided the library into two: half was purified following the standard Illumina protocol, through a Qiaquick PCR cleanup column, whereas the other was purified using SPRI technology. Each was then run on an agarose gel alongside a 100bp ladder to view the DNA species that remained. PCR LIBRARY KPOA0006 KPOC0002 KPOA0005 KPOC0001 NA18507 KPOC0005 KPOA0010 KPOA0008 KPOC0004 KPOC0003 KPOA0017 KPOA0014 PCR duplication example; UNPAIRED READS EXAMINED 62519 57432 45961 51485 21791 54337 25997 48848 38812 201355 74130 52506 READ PAIRS EXAMINED 5464702 3448312 3143590 2884859 2187848 3648741 2449286 3474580 2350763 4528357 3097782 3493530 UNMAPPED READS 986509 624078 562785 547339 369343 681663 410855 628848 396988 1027539 600782 618672 UNPAIRED READ DUPLICATES 47544 33414 21530 32763 15030 47073 17482 33125 24710 137213 48333 37310 READ PAIR DUPLICATES 2657808 542256 351362 596494 707778 2802655 711382 1017855 528626 2028173 1114520 1206707 READ PAIR OPTICAL DUPLICATES 15731 16503 9954 10627 7613 14976 8187 10306 8809 23747 15594 11793 PERCENT DUPLICATION 0.487918 0.160759 0.114359 0.210567 0.325319 0.768841 0.292461 0.295632 0.228246 0.452963 0.363235 0.348136 ESTIMATED LIBRARY SIZE 3598454 10024617 13316441 6055683 2620318 858549 3376826 4734070 4462098 3410538 3218521 3829677 Pre hybridisation PCR cycles 5 5 5 5 5 6 5 5 5 5 5 5 Post hybridisation PCR cycles 16 12 16 12 12 12 12 12 12 12 12 12 Quantification Optimal concentration range of DNA that will yield clusters in the optimal density range. Spectrophotometry is not accurate. From [bp] 200 Corr. To [bp] Area 1,000 232.6 % of Total 79 Average Size [bp] 375 Size distribution in CV [%] Conc. [pg/µl] 24.1 Molarity [pmol/l] 165.15 714.3 Quantitative PCR. Quantify unknown libraries against standard libraries that have been sequenced previously for which cluster number is known. Electrophoresis with Agilent bioanalyser -Gives a check of size distribution. -Can be inaccurate for a small proportion of libraries, may be due to single stranded DNA not easily quantified when mixed with double stranded -Can use the bioanalyser to check size distribution and Fluorometery to determine the concentration more accurately (e.g. Qubit dsDNA BR Assay) Quantification a) Cluster throughput as a function of total clusters for 200 and 500bp inserts. The 500bp inserts underwent fewer cycles of cluster amplification (28, compared to 35 for the 200bp libraries), resulting in smaller clusters, and so a cluster density of 40-44k / tile (GA1) will produce the maximum yield from either insert size. b) Standardisation of cluster density with qPCR quantification. Runs were grouped into 25-run bins and a boxplot plotted. After some initial problems with degradation of standards, cluster number has levelled out at ~35-40k / tile. Denaturation For low concentrations of Double stranded DNA denaturation by heating can damage DNA and introduce G+C bias. Use Modified hybrization buffers; prefer use of 0.1NaOH to heating. Subnanomolar libraries require an alternative buffer. Addition of Tris to illumina buffer prevents rise in pH. Diluting supplied 2M NaOH and using a greater volume reduces fluctuation caused by pipetting error. 1. 2. Denaturation a) pH titration of hybridisation buffers. The concentration of NaOH in DNA templates is 0.1M NaOH. Adding more than 8μl of this denatured template to the 1ml of Hybridisation Buffer prior to loading DNA onto the flowcell, increases the pH to above 10. This prevents efficient hybridisation, and thus the cluster density falls. The addition of Tris-HCl pH7.3 to the supplied bottles of Hybridisation Buffer dramatically increases buffering capacity, making template hybridisation more robust. b) the addition of 5mM Tris-HCl pH 7.3 to Illumina Hybridisation Buffer allows a greater volume of denatured template to be added before high pH prevents effective annealing of templates to the oligos on the flowcell surface. This increases the robustness of cluster generation, by counteracting pipetting errors in the denaturation step. Amplification Quality control After cluster amplification double stranded DNA on the flow cell can be stained using an intercalating dye to be detected by a fluorescence microscope. Use on flow cells before linearization and blocking to confirm that the cluster density is appropriate. Additions to the method Careful DNA quantification before fragmentation and checking for degraded DNA. Use of low absorbing plastic ware (Linnarsson 2010), e.g Beckman Coulter “non stick” or equivalent. Also advise to add some detergent (e.g. 0.02% Tween-20) to reduce absorption to tube walls. The implementation of SPRI XP beads for all purification steps. The use of the bioanalyser to check concentration and size distribution after fragmentation. Cheaper alternatives to illumina kits, e.g. NEB kits, making own adapters and primers. Conclusion The Genome Analyzer is a powerful sequencing technology, Here the authors describe a number of modifications that allow for more efficient library preparation, and which enable a stable workflow in a production environment. At the Sanger Institute, they have several teams for every stage of sequencing. All steps in the process are recorded using custom-written labtracking and run-tracking database software. Combined with improvements to the image analysis software and a faster run time, they predicted that by Christmas 2008, their output will reach 6-10 terabases of high-quality sequence per year - equivalent to 180 human genomes at 15-fold coverage, or approximately 200,000 bases per second. The improved workflow and high yield should maintain the Genome Analyzer as their next-generation sequencing platform of choice for the immediate future. But how long this remains true depends upon the performance of existing rival technologies, and those that are on the horizon. For example Oxford Nanopore Technologies, and Pacific Biosciences’ Single Molecule Real Time technology which promise to bring us closer to the eagerly anticipated $1,000 genome.
