Roadblocks to Critical Thinking
advertisement
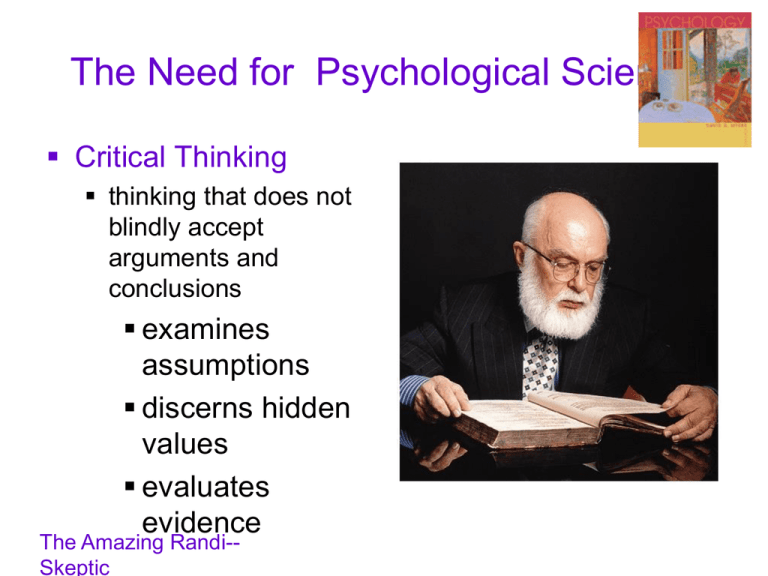
The Need for Psychological Science Critical Thinking thinking that does not blindly accept arguments and conclusions examines assumptions discerns hidden values evaluates evidence The Amazing Randi-Skeptic Critical Thinking • • Roadblocks to Critical Thinking: The Limits of Intuition and Common Sense We are not passive recipients of information, we ACTIVELY INTERPRET and construct our social perceptions to fit our preconceived notions of how the world works and operates. – People are basically LAZY THINKERS; willing to infer and judge by using mental “shortcuts” and otherwise not thinking too much about things. • People make sense of their world by fitting it to their preconceived notions The Need for Psychological Science Theory an explanation using an integrated set of principles that organizes and predicts observations Hypothesis a testable prediction often implied by a theory The Need for Psychological Science Operational Definition a statement of procedures (operations) used to define research variables Example intelligence may be operationally defined as what an intelligence test measures The Need for Psychological Science Replication repeating the essence of a research study to see whether the basic finding generalizes to other participants and circumstances usually with different participants in different situations Description Psychologists describe behavior using case studies, surveys, and naturalistic observation Description Case Study Psychologists study one or more individuals in great depth in the hope of revealing things true of us all Is language uniquely human? Description Survey technique for ascertaining the self-reported attitudes or behaviors of people usually by questioning a representative, random sample of people Random Sample a sample that fairly represents a population because each member has an equal chance of inclusion Description False Consensus Effect tendency to overestimate the extent to which others share our beliefs and behaviors Population all the cases in a group, from which samples may be drawn for a study Intuition and Common Sense • Intuition and Common Sense • We are not passive recipients of information, we ACTIVELY INTERPRET and construct our social perceptions to fit our preconceived notions of how the world works and operates. – People are basically LAZY THINKERS; willing to infer and judge by using mental “shortcuts” and otherwise not thinking too much about things. – People make sense of their world by fitting it to their preconceived notions Hindsight Bias • Hindsight Bias – tendency to believe that one would have foreseen it after the results are shown. “Seems like common sense.” “The answer was right there and look how obvious it was.” “I knew it all along.” – EX: Research on low selfesteem or high self-esteem and susceptibility to flattery. Perception that psychological research findings merely verify our common-sense understanding Hindsight Bias – EX: Several weeks after a political election, voters often exaggerate their ability to have predicted the election outcome. – EX: Mike’s stockbroker has informed him of substantial investment losses. When Mike tells his wife, she angrily responds, “I could have told you that your investment plan would fail.” Hindsight Bias • False Consensus Effect – we believe others agree with us more than they do. We spend most of out time with a biased sample of people, mostly those who share our attitudes and habits. – EX: David Letterman Activity – EX: Conservatives think more people support conservative views than will people who are liberals. – EX: You mistakenly assume that everyone around you enjoys listening to country music like you do. Overconfidence Effect • Overconfidence Effect – you are more confident about how quickly they can complete assignments or how well they did on a test. A result of the self-serving bias. – EX: When American students start college, only 2% say there is a very good chance they will drop out permanently or temporarily. – EX: Planners often exhibit overconfidence in estimating how quickly and inexpensively they can do a project. – EX: Students are overconfident about how quickly they can do assignments and write papers. Confirmation Bias • Confirmation Bias – we seek out or notice evidence that will verify our ideas more eagerly than we seek evidence that might refute them – EX: Stereotypes we hold – EX: Business managers are more likely to follow the successful careers of those they once hired than to track the achievements of those they rejected. Belief Perseverance • Belief Perseverance – tendency to cling to our beliefs in the face of contrary evidence. – EX: Thomas believes that rich people are stuck up. His friend, Elaine, introduces him to several rich people who are not at all stuck up. Thomas still believes rich people are stuck up. – EX: Coaches continue to believe that hot hands in bball exist Illusory Correlations • Both belief perseverance and confirmation bias are results of people making illusory correlations (perceived correlation that does not really exist) – when we believe there is a relationship between two things, we are likely to notice and recall instance that confirm our belief • EX: Infertile couples who adopt become more likely to conceive • EX Hot hands in b-ball • EX: “Of course it rained. That is because I just washed my car!” Representative Heuristic • Representative Heuristic judge a person, object, or event by how similar it is to what you imagine to be a typical representative of a category. – We think that people who exhibit certain characteristics will exhibit other, related characteristics. We think that “like goes with like” • EX: If I meet someone with a laid back attitude and long hair, I might assume they are Californian, whereas someone who is very polite but rigid may be assumed to be English. Heuristic Example • EX: People who were told that Linda majored in philosophy and was a social activist. Then they ranked the probability of statements about Linda – Linda is a bank teller – Linda is a bank teller and a feminist » 80% of people rated the statement “Linda is a bank teller and a feminist” as more likely than “Linda is a bank teller” » This contradicts the fact that the probability of x is greater than the probability of x and y co-occurring (when x and y are independent events) Availability Heuristic • Availability Heuristic – people judge the frequency of an event by how easily it is brought to mind. – EX: People think jet crashes are frequent because instances of them are salient, or easily brought to mind. – EX: Subjects guess that more people die from guns than asthma, cancer than stroke, murder than floods. Yet, in each case they were wrong. perhaps Anchoring and Adjustment Heuristic • Anchoring and Adjustment Heuristic – make judgments by starting with an initial estimate and then adjust it to yield the final answer. When people are presented with an answer to a question, they use that answer as a reference point. – EX: Participants were shown a number, either 10 or 65. They were then asked to estimate the proportion of African nations in the UN. People who saw a 10 gave an average estimate of 25%. Those who saw a 65 gave an average estimate of 45% Correlational Study • Correlational Study • -A statistical measure of relationships that organizes a set of facts and reveals how accurately one behavior predicts another. • -e.g., more democratic parents have children who behave better • -CANNOT prove causation • -e.g., do democratic parents produce better behaved children? • -e.g., do better behaved children encourage parents to be democratic? Correlation Coefficient = r • Correlation Coefficient = r • -Statistical calculation that describes the direction and strength of the relationship between two variables. Correlation Coefficient = r • • • • • • • • -Positive correlation means when one goes up or down the other does too. Two variables change in the same direction, as x increases so does y (max +1.00) -Negative correlation: when one goes up, the other goes down and visa versa. Inverse relationship, as x increases y decreases (min –1.00) -Or not related! (~ 0.0) -The higher the absolute value of r, the stronger the relationship -Perfect correlation r = + or – 1.00 -EX: r = +.37 (r – correlation coefficient + - indicates direction of relationship .37 – indicates strength of relationship 0.00 to 1.00) Negative Correlation • • • • • • • -Negative correlation: when one goes up, the other goes down and visa versa. Inverse relationship, as x increases y decreases (min – 1.00) -Or not related! (~ 0.0) -The higher the absolute value of r, the stronger the relationship -Perfect correlation r = + or – 1.00 -EX: r = +.37 (r – correlation coefficient + - indicates direction of relationship .37 – indicates strength of relationship 0.00 to 1.00) Scatterplot • Scatterplot - a graphed cluster of dots, each of which represents the values of two variables. The slope of the points suggests the direction of the relationship between the two variables. The amount of scatter suggests the strength of the correlation (little scatter indicates high correlation). Illusory Correlation • A perceived correlation that does not really exist is an illusory correlation the perception of a relationship where none exists Measures of Central Tendency • Measures of Central Tendency • Summarizes a set of data by providing a representative number. • Mean - the arithmetic average • Ÿ Median - the center score, the score that divides a data set in two • Ÿ Mode - the score that occurs the most Measures of Variability • Measures of Variability • Indicates the dispersion or spread in a set of data – tell you if the scores are very different from one another or if they cluster around the mean • Range - the difference between the highest and lowest score in a set of data • Ÿ Standard deviation reflects the average distance between every score and the mean Scientific Method • Scientific Method • Scientific method - Set of rules and procedures on how to study, observe, or conduct experiments • Steps include: • 1. Formulate a research question • Generated by theories set of tentative explanations of behavior and mental processes. Hypothesis • Worded as a hypothesis assertion or prediction for a behavior stated as a testable proposition, usually in the form of an if-then statement • can be verified or falsified • examine relationships between variables – specific factors that are manipulated and measured in research. Research Methods • 2. Select the research method and design the study • Research methods include experiments, case studies, surveys, naturalistic observation • Must provide operational definitions statement of the specific procedures used and the behaviors studied (variables) in the research Collect the data • 3. Collect the data direct observations, questionnaires, interviews, psychological tests, physiological recordings, and examination of archival records • 4. Analyze the data and draw conclusions Report the findings- Professional Journals • 5. Report the findings • Report research in professional journals • Replication - repeating the essence of a research study, usually with different participants in different situations, to see whether the basic finding generalizes to other participants and circumstances. Report the findings • 5. Report the findings • Report research in professional journals • Replication - repeating the essence of a research study, usually with different participants in different situations, to see whether the basic finding generalizes to other participants and circumstances. Methods in Psychology • • • • • • • • • • Methods in Psychology Setting - field vs. laboratory Laboratory provide uniform conditions for all subjects permits elimination of irrelevant factors may seem artificial Field research behavior observed in realworld setting poor control over conditions measures may be more representative of reality Data Collection Methods • Data collection methods - selfreport vs. observational • Self-report - procedures in which people rate or describe their own behavior or mental state • Questionnaires/ surveys • rating scales on a scale from 1 to 7 rate your opinion of … • judgments about perceptions • on a scale from 1 to 100 how hot is ... Observational Methods • Observational methods researchers directly observe and record behavior rather than relying on subject descriptions • naturalistic observation researcher records behavior as it occurs naturally • tests - researcher presents stimuli or problems and records responses • experiments - researcher measures whether variables effect other variables in a controlled laboratory procedure. Descriptive Study • Descriptive Study • Describes a set of facts • Cannot be used to determine the causes of behavior Natural Observation • • • Naturalistic Observation – method of gathering descriptive information, involves watching behaviors of interest, without interfering, as they occur in their natural environments. Advantage = obtain data about a truly natural behavior rather than a behavior that is in reaction to contrived experimental situation Disadvantage = if participants realize they are being observed, their behavior becomes unnatural; difficult and time-consuming; controls are lacking; difficult to generalize the results of the research; scientific objectivity is lost if experimenters interact with participants Case Studies • Case Studies – an observation technique in which one person, group, or situation is studied in depth in the hope of revealing universal principles. Often combines observations, interviews, tests, and analyses of written records. • Advantage - useful in studying rare or complex phenomena • Disadvantage – can mislead us: any given individual may be atypical and lead to false conclusions Surveys • • • Survey – questionnaires, tests, or special interviews administered to a large, random group of people to ascertain their self-reported attitudes or behaviors. Advantage – enable researchers to describe the characteristics of a relatively small sample (a few hundred people) and then generalize that information to a larger population, quickly collect Disadvantage – easily biased (tend to hang around people like us), a small return rate means that the sample is not representative, wording of questions can have major effects on the opinions respondents express, not indepth, not answered truthfully Tests • Tests - measures various traits and characteristics in a population, such as intelligence, aptitude, and personality tests • Reliable – consistency of measurement. • Test-retest reliability – comparing scores on tests taken on different occasions. • Valid – degree to which test measures what it is supposed to measure Experimental Study • Experimental Study • Experiment = Carefully controlled scientific procedure in which a group of subjects obtains a treatment and are then observed carefully to determine whether the treatment makes a difference in their behavior. • Measures how variables manipulated by the experimenter have an effect on other variables. • Direct way to test a hypothesis about a cause-effect relationship between factors Experimental Study • Advantages – precise control available in the experiment allows them to isolate the relationship between the independent and dependent variable and find out causeand-effect relationships. • Disadvantages – experiments are artificial and require great control Can’t be used to explore some research questions because of ethical concerns and some manipulations of variables are difficult or impossible. Experimental Variables • • • • • • • • Experimental Variables Variables – specific factors or characteristics that can vary (weight, time, distance between people, scores on a test, number of responses) Independent variable the controlled factor in an experiment e.g., democratic vs. authoritarian classroom hypothesized to cause an effect on another variable totally independent of anything the subject does administered to the experimental group Experimental Variables • • • • • • Dependent variable the measurable behavior exhibited – before and after the administration of the independent variable e.g., cooperative behavior among students behaviors or mental processes affected by the independent variable Subject variables – age, gender, race, ethnicity, cultural background, socioeconomic status, sexual orientation, disability. Must consider the impact of variables on the behavior or mental processes being studied Situation-relevant variables - test conditions, experimenter behavior, timing Experimental Design • Experimental Design • Experimental vs. Control – experiments must have at least two groups of subjects so that the performance of one group can be compared with the other’s: • Experimental group – receives the independent variable or the treatment in an experiment Control group • • • • • Control group – does not receive the independent variable, thus providing a baseline for comparison to the experimental group. (this group is identical to the experimental group in every way except that these subjects do not receive independent variable) Any difference in the dependent variable between the control and experimental groups is caused by the independent variable Levels may differ between or within people Within-subject experiment - different levels of the independent variable are applied to the same subject Between-groups experiment - different levels of the independent variable are applied to different groups of subjects Human Participants • • • • • • Selecting Human Participants for Research Sampling = choosing subjects for research. The subjects chosen should be representative of the population (the total of all possible cases from which a sample is selected) being studied. Random sample - every member of pop. has an equal chance of being selected for the study Stratified sample – identified subgroups in the population are represented proportionately in the sample. Random assignment - every subject has an equal chance of being placed in either the experimental or control group (even/odd, draw straws) Randomization helps avoid false results Counterbalancing • Group matching – the nature of the experiment demands a certain population be used for an experiment instead of randomization. • Counterbalancing – change one variable with another, i.e. if one group of depressed clients received an IV in the am and the other group received a placebo in the pm, switch times Experimenter Flaws • • • • Experimenter Flaws Confounding of Variables - difficulty separating the effects of extraneous/random variables from those of the independent variable, thus confusing interpretation of the experimental data Extraneous/Random Variables uncontrolled factors that might have affected the dependent variable instead of or along with the independent variable (difference in subjects’ backgrounds, personalities, health, and so on, that might confound research results) Experimenter Bias / Observerexpectancy Effect - researcher affects the dependent variable by encouraging subjects to respond in a way that supports her hypothesis or experimental results BIAS • Subject-expectancy effect subject knows design and tries to produce expected result • To prevent bias, psychologists use blinding minimize expectancy by removing knowledge about experimental conditions • Single-blind study - when subjects are kept uninformed as to the treatment they are receiving • Demand characteristics – any cues in a study that suggest to subjects the purpose of the study or what the researcher hopes to find Placebo • • • • • • Double-blind study - neither the experimenter nor the subjects know who has received the independent variable. Volunteer Bias – people who offer or volunteer to participate in research studies differ from people who do not. Sample bias – sample is not truly representative of the population being studied. Everyone in the population of interest did not have an equal chance of being selected to participate in a study. Use random assignment to reduce the impact of random variables on the results Big sample – the larger the sample, the more likely it will represent a cross section of the entire population Placebo Effects – placebo is a physical or psychological treatment that contains no active ingredient but produces an effect on the dependent variable because the person receiving it believes it will. Quasi-Experiments • Quasi-Experiments – Use pre-existing groups, so not able to randomly assign participants. Conducted when an experiment with adequate controls would be unethical or impossible. Correlation Study • • • • • • • • • Correlation Study Organizes a set of facts and reveals relationships among facts e.g., more democratic parents have children who behave better Cannot prove causation Do democratic parents produce better behaved children? Correlation Study - Descriptive Statistics Used to describe or summarize sets of data to make them more understandable Data - a collection of numerical measurements of research results Statistics - mathematical descriptions of data (i.e., mean, medium, range) Measures of Central Tendency • Measures of Central Tendency • Summarizes a set of data by providing a representative number. • Mean - the arithmetic average • Median - the center score, the score that divides a data set in two • Mode - the score that occurs the most Measures of Variability • Measures of Variability • Indicates the dispersion or spread in a set of data – tell you if the scores are very different from one another or if they cluster around the mean • Range - the difference between the highest and lowest score in a set of data • Standard deviation - reflects the average distance between every score and the mean Correlation • • • • • • • • Correlation Coefficient Statistical calculation that describes the direction and strength of the relationship between two variables. Correlations do not indicate causation. Measures whether two variables change in a related way (r) Can be positive (max +1.00) – two variables change in the same direction, as x increases so does y Negative (min -1.00) – inverse relationship, as x increases y decreases Or not related! (~ 0.0) The higher the absolute value of r, the stronger the relationship Perfect correlation r = + or – 1.00 Scatterplot • Scatterplot - a graphed cluster of dots, each of which represents the values of two variables. The slope of the points suggests the direction of the relationship between the two variables. The amount of scatter suggests the strength of the correlation (little scatter indicates high correlation). • A perceived correlation that does not really exist is an illusory correlation - the perception of a relationship where none exists. Correlation Study Inferential Statistics • • • • • • • Correlation Study - Inferential Statistics Gives probability that the sample is like the world at large – draw conclusions and make inferences about what the data mean Probability means how likely something is How likely are results like mine to occur by chance? Statistical inferences significant result (statistically significant) – indicates that the group differences or correlation reflects the real world rather than chance, with high probability (e.g., > .95 ) not significant - results reflect chance Ethical Issues in Psychological Research • • • • • • • Ethical Issues in Psychological Research http://www.sciam.com/0297issue/ 0297forum.html Ethical Guidelines – rules about research, counseling, and teaching that psychologists are required to follow Right to privacy Informed consent vs. use of deception Participants will behave differently if know study Debrief participants after experiment – explain research process to participants Animal rights Ethical Issues in Psychological Research • • • • • • Ethical Issues in Psychological Research Ethical Guidelines – rules about research, counseling, and teaching that psychologists are required to follow Psych departments have review panels to screen all proposals for research - Institutional Review Board Scientists must accurately report their results, minimize subject discomfort, and prevent any long-term negative effects. Voluntary Participation - people cannot be coerced into participating in research. Right to Privacy - studies are conducted to ensure confidentiality Confidentiality • Confidentiality - information will not be made available to anyone who is not directly involved in the study • Anonymity - participant will remain anonymous throughout the study - even to the researchers. • Use coded numbers instead of individuals’ names and, if possible, data are reported in group form rather than individual responses Debriefing • Deception - not possible to tell whole truth about a study • Truth would bias the subjects behave differently if know study • However, involves risk to person’s self-esteem • Debriefing - subjects should be told about the purpose of the research, the hypotheses being tested, the nature of the results or anticipated results, and the implications of those results for the science of psychology immediately or soon after participation. • Issues of Risk • Issues of Risk - subjects should not be put at risk, except in cases where there is no other way to conduct research and research results offer promise to advance knowledge • Subjects have to sign consent form and can withdraw any time • Right to Service - treatment might have beneficial effects, so persons in no-treatment control group may be upset Animal rights • Animal rights - Animal Care Guidelines • Specify the proper care and maintenance of animals, including the adequacy of space requirements, maintenance of good health, and supervision by qualified personnel. • Researchers are required to make every effort to minimize the pain and discomfort of animal subjects and to seek alternative methods for their research if possible. Comparing Research Methods Frequently Asked Questions aout Psychology Why do psychologists study animals? Is it ethical to experiment on animals? Is it ethical to experiment on people? Frequently Asked Questions about Psychology • Is psychology free of value judgments? Is psychology potentially dangerous? Frequently Asked Questions about Psychology Does behavior vary with gender?


