Prevalence of Dyslipidemia Estimated from a Self
advertisement

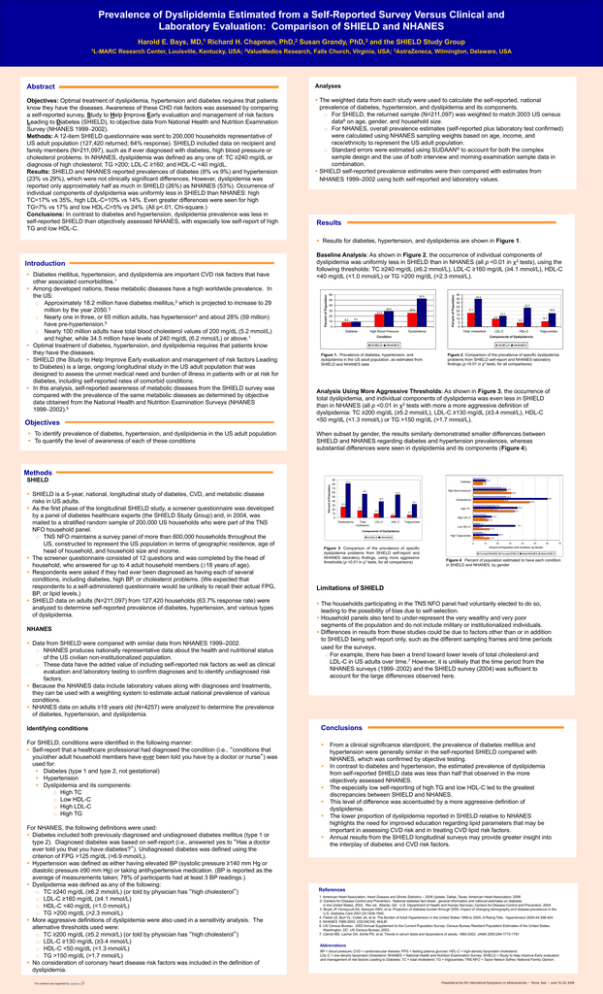
Prevalence of Dyslipidemia Estimated from a Self-Reported Survey Versus Clinical and Laboratory Evaluation: Comparison of SHIELD and NHANES Harold E. Bays, MD,1 Richard H. Chapman, PhD,2 Susan Grandy, PhD,3 and the SHIELD Study Group 1L-MARC Research Center, Louisville, Kentucky, USA; 2ValueMedics Research, Falls Church, Virginia, USA; 3AstraZeneca, Wilmington, Delaware, USA Abstract Analyses Objectives: Optimal treatment of dyslipidemia, hypertension and diabetes requires that patients know they have the diseases. Awareness of these CHD risk factors was assessed by comparing a self-reported survey, Study to Help Improve Early evaluation and management of risk factors Leading to Diabetes (SHIELD), to objective data from National Health and Nutrition Examination Survey (NHANES 19992002). Methods: A 12-item SHIELD questionnaire was sent to 200,000 households representative of US adult population (127,420 returned; 64% response). SHIELD included data on recipient and family members (N=211,097), such as if ever diagnosed with diabetes, high blood pressure or cholesterol problems. In NHANES, dyslipidemia was defined as any one of: TC ≥240 mg/dL or diagnosis of high cholesterol; TG >200; LDL-C ≥160; and HDL-C <40 mg/dL. Results: SHIELD and NHANES reported prevalences of diabetes (8% vs 9%) and hypertension (23% vs 29%), which were not clinically significant differences. However, dyslipidemia was reported only approximately half as much in SHIELD (26%) as NHANES (53%). Occurrence of individual components of dyslipidemia was uniformly less in SHIELD than NHANES: high TC=17% vs 35%, high LDL-C=10% vs 14%. Even greater differences were seen for high TG=7% vs 17% and low HDL-C=5% vs 24%. (All p<.01, Chi-square.) Conclusions: In contrast to diabetes and hypertension, dyslipidemia prevalence was less in self-reported SHIELD than objectively assessed NHANES, with especially low self-report of high TG and low HDL-C. The weighted data from each study were used to calculate the self-reported, national prevalence of diabetes, hypertension, and dyslipidemia and its components. o For SHIELD, the returned sample (N=211,097) was weighted to match 2003 US census data6 on age, gender, and household size. o For NHANES, overall prevalence estimates (self-reported plus laboratory test confirmed) were calculated using NHANES sampling weights based on age, income, and race/ethnicity to represent the US adult population. o Standard errors were estimated using SUDAAN® to account for both the complex sample design and the use of both interview and morning examination sample data in combination. SHIELD self-reported prevalence estimates were then compared with estimates from NHANES 1999–2002 using both self-reported and laboratory values. Results Results for diabetes, hypertension, and dyslipidemia are shown in Figure 1. Objectives To identify prevalence of diabetes, hypertension, and dyslipidemia in the US adult population To quantify the level of awareness of each of these conditions 60 52.9 50 40 28.9 30 25.8 23.4 20 8.2 10 9.0 0 Diabetes High Blood Pressure Dyslipidemia Percent of Population Diabetes mellitus, hypertension, and dyslipidemia are important CVD risk factors that have other associated comorbidities.1 Among developed nations, these metabolic diseases have a high worldwide prevalence. In the US: o Approximately 18.2 million have diabetes mellitus,2 which is projected to increase to 29 million by the year 2050.3 o Nearly one in three, or 65 million adults, has hypertension4 and about 28% (59 million) have pre-hypertension.5 o Nearly 100 million adults have total blood cholesterol values of 200 mg/dL (5.2 mmol/L) and higher, while 34.5 million have levels of 240 mg/dL (6.2 mmol/L) or above.1 Optimal treatment of diabetes, hypertension, and dyslipidemia requires that patients know they have the diseases. SHIELD (the Study to Help Improve Early evaluation and management of risk factors Leading to Diabetes) is a large, ongoing longitudinal study in the US adult population that was designed to assess the unmet medical need and burden of illness in patients with or at risk for diabetes, including self-reported rates of comorbid conditions. In this analysis, self-reported awareness of metabolic diseases from the SHIELD survey was compared with the prevalence of the same metabolic diseases as determined by objective data obtained from the National Health and Nutrition Examination Surveys (NHANES 19992002).5 Percent of Population Introduction Baseline Analysis: As shown in Figure 2, the occurrence of individual components of dyslipidemia was uniformly less in SHIELD than in NHANES (all p <0.01 in χ2 tests), using the following thresholds: TC ≥240 mg/dL (≥6.2 mmol/L), LDL-C ≥160 mg/dL (≥4.1 mmol/L), HDL-C <40 mg/dL (<1.0 mmol/L) or TG >200 mg/dL (>2.3 mmol/L). 40 35 30 25 20 15 10 5 0 34.8 23.7 17.1 16.9 13.7 9.5 Total cholesterol Condition SHIELD 6.7 5.0 LDL-C HDL-C Triglycerides Components of Dyslipidemia NHANES SHIELD Figure 1. Prevalence of diabetes, hypertension, and dyslipidemia in the US adult population, as estimated from SHIELD and NHANES data NHANES Figure 2. Comparison of the prevalence of specific dyslipidemia problems from SHIELD self-report and NHANES laboratory findings (p <0.01 in χ2 tests, for all comparisons) Analysis Using More Aggressive Thresholds: As shown in Figure 3, the occurrence of total dyslipidemia, and individual components of dyslipidemia was even less in SHIELD than in NHANES (all p <0.01 in χ2 tests with more a more aggressive definition of dyslipidemia: TC ≥200 mg/dL (≥5.2 mmol/L), LDL-C ≥130 mg/dL (≥3.4 mmol/L), HDL-C <50 mg/dL (<1.3 mmol/L) or TG >150 mg/dL (>1.7 mmol/L). When subset by gender, the results similarly demonstrated smaller differences between SHIELD and NHANES regarding diabetes and hypertension prevalences, whereas substantial differences were seen in dyslipidemia and its components (Figure 4). Methods SHIELD NHANES Data from SHIELD were compared with similar data from NHANES 1999–2002. o NHANES produces nationally representative data about the health and nutritional status of the US civilian non-institutionalized population. o These data have the added value of including self-reported risk factors as well as clinical evaluation and laboratory testing to confirm diagnoses and to identify undiagnosed risk factors. Because the NHANES data include laboratory values along with diagnoses and treatments, they can be used with a weighting system to estimate actual national prevalence of various conditions. NHANES data on adults ≥18 years old (N=4257) were analyzed to determine the prevalence of diabetes, hypertension, and dyslipidemia. Percent of Population SHIELD is a 5-year, national, longitudinal study of diabetes, CVD, and metabolic disease risks in US adults. As the first phase of the longitudinal SHIELD study, a screener questionnaire was developed by a panel of diabetes healthcare experts (the SHIELD Study Group) and, in 2004, was mailed to a stratified random sample of 200,000 US households who were part of the TNS NFO household panel. o TNS NFO maintains a survey panel of more than 600,000 households throughout the US, constructed to represent the US population in terms of geographic residence, age of head of household, and household size and income. The screener questionnaire consisted of 12 questions and was completed by the head of household, who answered for up to 4 adult household members (18 years of age). Respondents were asked if they had ever been diagnosed as having each of several conditions, including diabetes, high BP, or cholesterol problems. (We expected that respondents to a self-administered questionnaire would be unlikely to recall their actual FPG, BP, or lipid levels.) SHIELD data on adults (N=211,097) from 127,420 households (63.7% response rate) were analyzed to determine self-reported prevalence of diabetes, hypertension, and various types of dyslipidemia. 90 80 23.0 70 60 50 27.0 30.8 26.9 38.5 Dyslipidemia 40 30 20 23.8 54.9 60.2 24.8 45.8 32.1 25.8 18.0 17.1 High TC 9.5 5.0 Total cholesterol 33.7 10.4 15.2 8.7 12.3 High LDL-C 0 Dyslipidemia 35.9 16.3 6.7 10 LDL-C HDL-C Triglycerides 5.5 Low HDL-C 34.1 4.5 13.4 Components of Dyslipidemia SHIELD NHANES 7.5 6.0 High Triglycerides 0 Figure 3. Comparison of the prevalence of specific dyslipidemia problems from SHIELD self-report and NHANES laboratory findings, using more aggressive thresholds (p <0.01 in χ2 tests, for all comparisons) 10 20.5 13.5 20 30 40 50 60 70 Percent of Population with Condition, by Gender Female/NHANES Female/SHIELD Male/NHANES Male/SHIELD Figure 4. Percent of population estimated to have each condition in SHIELD and NHANES, by gender Limitations of SHIELD The households participating in the TNS NFO panel had voluntarily elected to do so, leading to the possibility of bias due to self-selection. Household panels also tend to under-represent the very wealthy and very poor segments of the population and do not include military or institutionalized individuals. Differences in results from these studies could be due to factors other than or in addition to SHIELD being self-report only, such as the different sampling frames and time periods used for the surveys. o For example, there has been a trend toward lower levels of total cholesterol and LDL-C in US adults over time.7 However, it is unlikely that the time period from the NHANES surveys (19992002) and the SHIELD survey (2004) was sufficient to account for the large differences observed here. Conclusions For SHIELD, conditions were identified in the following manner: Self-report that a healthcare professional had diagnosed the condition (i.e., “conditions that you/other adult household members have ever been told you have by a doctor or nurse”) was used for: Diabetes (type 1 and type 2, not gestational) Hypertension Dyslipidemia and its components: o High TC o Low HDL-C o High LDL-C o High TG This research was supported by High blood pressure 56.8 Identifying conditions For NHANES, the following definitions were used: Diabetes included both previously diagnosed and undiagnosed diabetes mellitus (type 1 or type 2). Diagnosed diabetes was based on self-report (i.e., answered yes to “Has a doctor ever told you that you have diabetes?”). Undiagnosed diabetes was defined using the criterion of FPG >125 mg/dL (>6.9 mmol/L). Hypertension was defined as either having elevated BP (systolic pressure ≥140 mm Hg or diastolic pressure ≥90 mm Hg) or taking antihypertensive medication. (BP is reported as the average of measurements taken; 78% of participants had at least 3 BP readings.) Dyslipidemia was defined as any of the following: o TC ≥240 mg/dL (≥6.2 mmol/L) (or told by physician has “high cholesterol”) o LDL-C ≥160 mg/dL (≥4.1 mmol/L) o HDL-C <40 mg/dL (<1.0 mmol/L) o TG >200 mg/dL (>2.3 mmol/L) More aggressive definitions of dyslipidemia were also used in a sensitivity analysis. The alternative thresholds used were: o TC ≥200 mg/dL (≥5.2 mmol/L) (or told by physician has “high cholesterol”) o LDL-C ≥130 mg/dL (≥3.4 mmol/L) o HDL-C <50 mg/dL (<1.3 mmol/L) o TG >150 mg/dL (>1.7 mmol/L) No consideration of coronary heart disease risk factors was included in the definition of dyslipidemia. 8.5 10.2 7.9 7.8 Diabetes 81.4 From a clinical significance standpoint, the prevalence of diabetes mellitus and hypertension were generally similar in the self-reported SHIELD compared with NHANES, which was confirmed by objective testing. In contrast to diabetes and hypertension, the estimated prevalence of dyslipidemia from self-reported SHIELD data was less than half that observed in the more objectively assessed NHANES. The especially low self-reporting of high TG and low HDL-C led to the greatest discrepancies between SHIELD and NHANES. This level of difference was accentuated by a more aggressive definition of dyslipidemia. The lower proportion of dyslipidemia reported in SHIELD relative to NHANES highlights the need for improved education regarding lipid parameters that may be important in assessing CVD risk and in treating CVD lipid risk factors. Annual results from the SHIELD longitudinal surveys may provide greater insight into the interplay of diabetes and CVD risk factors. References 1. American Heart Association. Heart Disease and Stroke Statistics – 2006 Update. Dallas, Texas: American Heart Association; 2006. 2. Centers for Disease Control and Prevention. National diabetes fact sheet: general information and national estimates on diabetes in the United States, 2003. Rev ed. Atlanta, GA: U.S. Department of Health and Human Services, Centers for Disease Control and Prevention, 2004. 3. Boyle JP, Honeycutt AA, Narayan KMV, et al. Projection of diabetes burden through 2050. Impact of changing demography and disease prevalence in the U.S. Diabetes Care 2001;24:1936-1940. 4. Fields LE; Burt VL; Cutler JA, et al. The Burden of Adult Hypertension in the United States 1999 to 2000. A Rising Tide. Hypertension 2004;44:398-404. 5. NHANES 1999-2002, CDC/NCHS, NHLBI 6. US Census Bureau. 2003 Annual Supplement to the Current Population Survey: Census Bureau Resident Population Estimates of the United States. Washington, DC: US Census Bureau; 2003. 7. Carroll MD, Lacher DA, Sorlie PD, et al. Trends in serum lipids and lipoproteins of adults, 1960-2002. JAMA 2005;294:1773-1781 Abbreviations BP = blood pressure; CVD = cardiovascular disease; FPG = fasting plasma glucose; HDL-C = high-density lipoprotein cholesterol; LDL-C = low-density lipoprotein cholesterol; NHANES = National Health and Nutrition Examination Survey; SHIELD = Study to Help Improve Early evaluation and management of risk factors Leading to Diabetes; TC = total cholesterol; TG = triglycerides; TNS NFO = Taylor Nelson Sofres National Family Opinion Presented at the XIV International Symposium on Atherosclerosis • Rome, Italy • June 18–22, 2006


