Relative versus cancer-specific survival:
assumptions and potential bias
Diana
1
Sarfati ,
1University
Matt
1
Soeberg ,
Kristie
of Otago Wellington, New Zealand
1
Carter ,
2Centre
Neil
2
Pearce ,
for Public Health Research, Massey University
Results
Background
Cancer-specific and relative survival analyses
are the two main methods of estimating net
cancer survival.
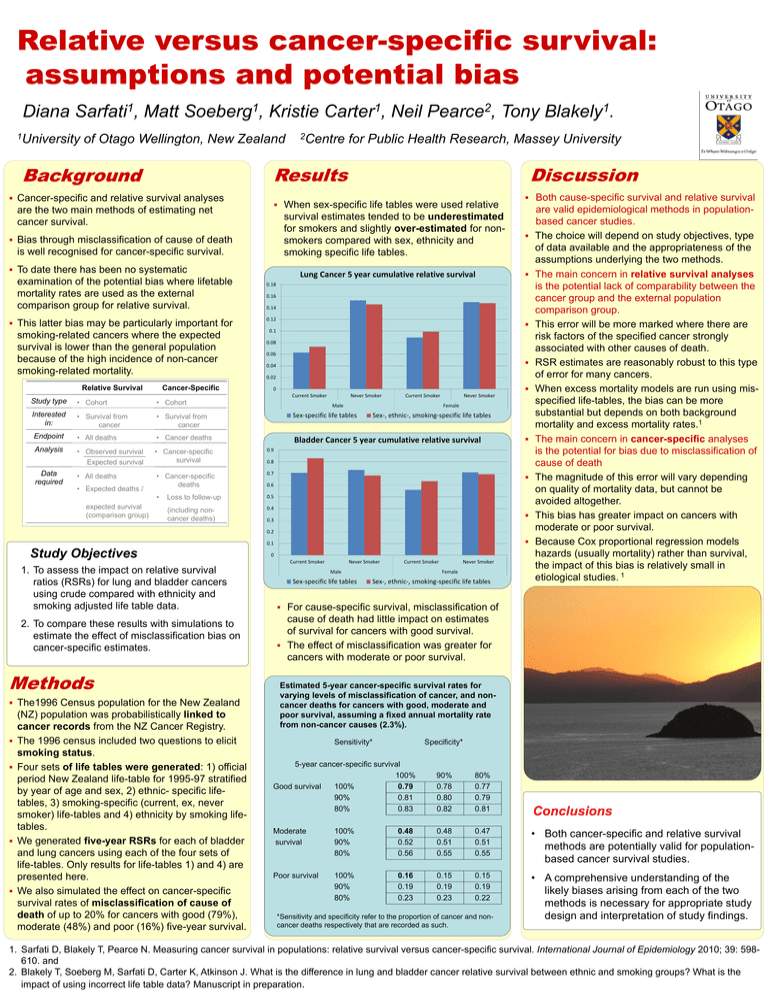
survival estimates tended to be underestimated
for smokers and slightly over-estimated for nonsmokers compared with sex, ethnicity and
smoking specific life tables.
is well recognised for cancer-specific survival.
To date there has been no systematic
examination of the potential bias where lifetable
mortality rates are used as the external
comparison group for relative survival.
This latter bias may be particularly important for
smoking-related cancers where the expected
survival is lower than the general population
because of the high incidence of non-cancer
smoking-related mortality.
Relative Survival
Cancer-Specific
Discussion
When sex-specific life tables were used relative
Bias through misclassification of cause of death
Lung Cancer 5 year cumulative relative survival
0.14
0.12
0.1
0.08
0.06
0.04
0.02
0
Current Smoker
Never Smoker
Current Smoker
Never Smoker
• Cohort
Interested
in:
• Survival from
cancer
• Survival from
cancer
Sex-specific life tables
Endpoint
• All deaths
• Cancer deaths
Bladder Cancer 5 year cumulative relative survival
Analysis
• Observed survival
Expected survival
• Cancer-specific
survival
• All deaths
• Cancer-specific
deaths
0.7
•
Loss to follow-up
0.5
(including noncancer deaths)
0.4
expected survival
(comparison group)
0.16
• Cohort
• Expected deaths /
Both cause-specific survival and relative survival
0.18
Study type
Data
required
Tony
Male
Female
Sex-, ethnic-, smoking-specific life tables
0.9
0.8
0.6
0.3
0.2
0.1
Study Objectives
1. To assess the impact on relative survival
ratios (RSRs) for lung and bladder cancers
using crude compared with ethnicity and
smoking adjusted life table data.
2. To compare these results with simulations to
estimate the effect of misclassification bias on
cancer-specific estimates.
Methods
The1996 Census population for the New Zealand
(NZ) population was probabilistically linked to
cancer records from the NZ Cancer Registry.
The 1996 census included two questions to elicit
smoking status.
Four sets of life tables were generated: 1) official
period New Zealand life-table for 1995-97 stratified
by year of age and sex, 2) ethnic- specific lifetables, 3) smoking-specific (current, ex, never
smoker) life-tables and 4) ethnicity by smoking lifetables.
We generated five-year RSRs for each of bladder
and lung cancers using each of the four sets of
life-tables. Only results for life-tables 1) and 4) are
presented here.
We also simulated the effect on cancer-specific
survival rates of misclassification of cause of
death of up to 20% for cancers with good (79%),
moderate (48%) and poor (16%) five-year survival.
0
Current Smoker
1
Blakely .
Never Smoker
Current Smoker
Male
Sex-specific life tables
Never Smoker
Female
Sex-, ethnic-, smoking-specific life tables
are valid epidemiological methods in populationbased cancer studies.
The choice will depend on study objectives, type
of data available and the appropriateness of the
assumptions underlying the two methods.
The main concern in relative survival analyses
is the potential lack of comparability between the
cancer group and the external population
comparison group.
This error will be more marked where there are
risk factors of the specified cancer strongly
associated with other causes of death.
RSR estimates are reasonably robust to this type
of error for many cancers.
When excess mortality models are run using misspecified life-tables, the bias can be more
substantial but depends on both background
mortality and excess mortality rates.1
The main concern in cancer-specific analyses
is the potential for bias due to misclassification of
cause of death
The magnitude of this error will vary depending
on quality of mortality data, but cannot be
avoided altogether.
This bias has greater impact on cancers with
moderate or poor survival.
Because Cox proportional regression models
hazards (usually mortality) rather than survival,
the impact of this bias is relatively small in
etiological studies. 1
For cause-specific survival, misclassification of
cause of death had little impact on estimates
of survival for cancers with good survival.
The effect of misclassification was greater for
cancers with moderate or poor survival.
Estimated 5-year cancer-specific survival rates for
varying levels of misclassification of cancer, and noncancer deaths for cancers with good, moderate and
poor survival, assuming a fixed annual mortality rate
from non-cancer causes (2.3%).
Sensitivity*
Specificity*
5-year cancer-specific survival
100%
Good survival
100%
0.79
90%
0.81
80%
0.83
90%
0.78
0.80
0.82
80%
0.77
0.79
0.81
Conclusions
Moderate
survival
100%
90%
80%
0.48
0.52
0.56
0.48
0.51
0.55
0.47
0.51
0.55
• Both cancer-specific and relative survival
methods are potentially valid for populationbased cancer survival studies.
Poor survival
100%
90%
80%
0.16
0.19
0.23
0.15
0.19
0.23
0.15
0.19
0.22
• A comprehensive understanding of the
likely biases arising from each of the two
methods is necessary for appropriate study
design and interpretation of study findings.
*Sensitivity and specificity refer to the proportion of cancer and noncancer deaths respectively that are recorded as such.
1. Sarfati D, Blakely T, Pearce N. Measuring cancer survival in populations: relative survival versus cancer-specific survival. International Journal of Epidemiology 2010; 39: 598610. and
2. Blakely T, Soeberg M, Sarfati D, Carter K, Atkinson J. What is the difference in lung and bladder cancer relative survival between ethnic and smoking groups? What is the
impact of using incorrect life table data? Manuscript in preparation.


