Shape Matching and Classification Using Height Functions
advertisement
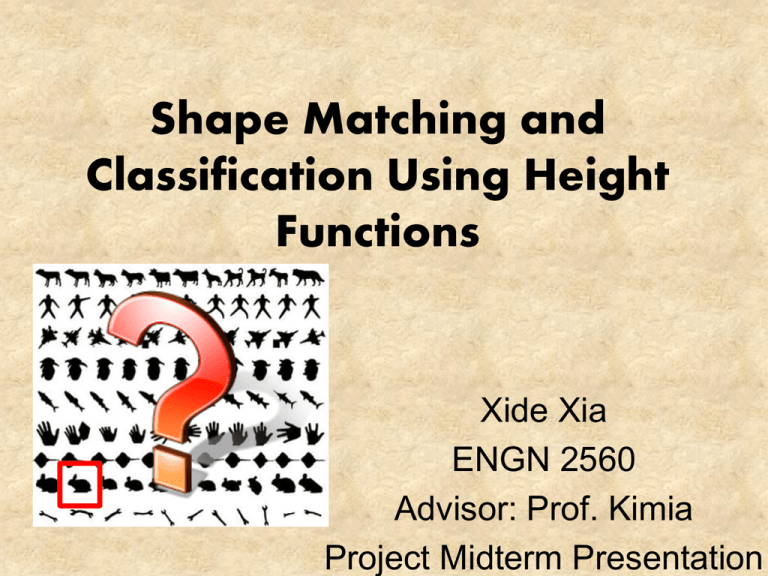
Shape Matching and Classification Using Height Functions Xide Xia ENGN 2560 Advisor: Prof. Kimia Project Midterm Presentation Schedule • Week1~2: Debug and Run the codes in my computer successfully • Week3~4: Read codes carefully and try to understand how does each part works and the relations among them • Week5~6: Test with different dataset (such as MPEG-7 data set, Kimia’s data set, ETH-80 data set) • Week7:Compare with other shape matching algorithm (with shock graph) • Week8: Make conclusion and prepare for the final presentation Main.m • batch_HF .m : calculating the original height functions features for all shapes in some data set, and storing them in one .mat file • hisHF.m : smoothing and local normalization • HF_shape_retrieval .m : DP matching based on height functions • HF_SC .m : improving shape similarity values by shape complexity batch_HF.m - Compute height function features for images • sample every image and get scale values • Contour extraction: Cs = extract_longest_cont(im, n_contour); • HF for all landmark points hf = compu_contour_HF(Cs); • save for all shapes hisHF .m : % smoothing and local normalization • Smoothed height values: F is an M *N matrix with column i being the shape descriptor Fi of the sample point Xi. HF_shape_retrieval .m : % DP matching based on height functions • matching score save: Score = zeros(m-2); • matching the two shapes with their feature by DP • compute the cost matrix b/w points in feature1 and feature2. (in current order/ in reverse order) • get the best result HF_SC .m : % improving shape similarity values by shape complexity • shape complexity • add shape complexity to score Shape descriptor with height functions: • • • • • A sequence of equidistant sample points X Tangent line Li Height value Hi Smoothed height values Local nomalization Similarity measure using the height descriptor: • • • • • The cost (distance) of matching p and q Weight coefficient Dissimilarity between the two shapes Shape complexity Dissimilarity normalized by complexity values compute matching accuracy bull’s eyes score: which counts how many objects within the 40 most similar objects belong to the class of the query object. Every shape in the data set is used as a query, and the retrieval result for the whole data set is obtained by averaging among all shapes. Test codes with Kimia Dataset matching accuracy 1. bird 2.bones 3. brick 4.camel 5.car TODO: • Test with more different dataset (such as MPEG-7 data set,ETH-80 data set) • Compare with other shape matching algorithm (with shock graph) • Make conclusion and prepare for the final presentation Reference: • Shape matching and classification using height functions(Junwei Wanga, Xiang Bai a, Xinge You, Wenyu Liu, Longin Jan Latecki)


