Paraffin & Class Ratios Interpretation usage guide
advertisement
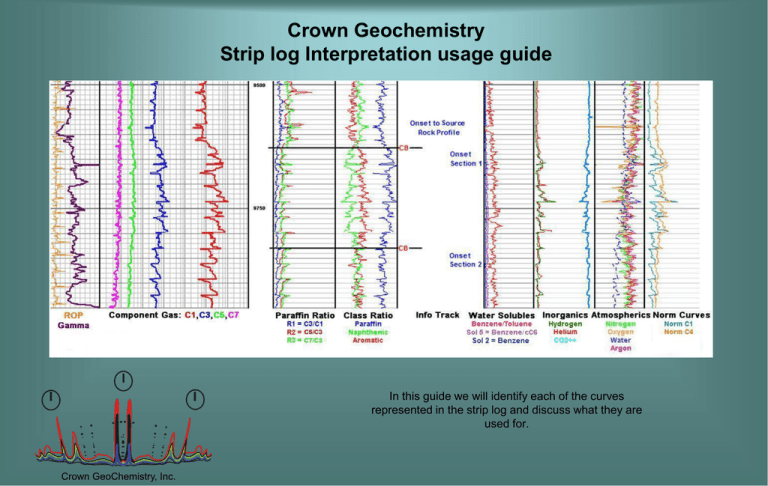
Crown Geochemistry Strip log Interpretation usage guide In this guide we will identify each of the curves represented in the strip log and discuss what they are used for. Crown GeoChemistry, Inc. Strip Log Interpretation usage guide Here is a brief summary of the different columns and what they contain. 1. Component Gas: 2. Paraffin Ratio: 3. Class Ratio: 4. 5. Info Column: Water Solubles: 6. 7. Inorganic Compounds: Atmospherics: 8. Norm Curves: Crown GeoChemistry, Inc. Displays hydrocarbons C1, C3, C5, C7, C9 and C10. Gas is displayed as parts per million (ppm). These ratios key on light, medium, and heavier hydrocarbons against methane and propane. R1 = C3/C1, R2 = C5/C3, R3 = C7/C3. This track ratios each major class of hydrocarbons (paraffin, naphthenic, aromatic) to the sum of the three. This includes any notes or observations. This track identifies water soluble compounds. Sol 1 = ratio of Benzene/Toluene, Sol 2 = Benzene, and Sol 5 = Benzene/cC6. Displays quantity of listed inorganics; Helium, Hydrogen, and Carbon dioxide. Displays quantity of most abundant atmospheric constituents; Argon, Oxygen, Nitrogen, and Water. These curves are taken from the path plot presentation. The curves normally shown are Norm C1 and Norm C4. Component Gas Interpretation usage guide The component gas portion of our strip log displays hydrocarbons C1, C3, C5, C7, C9, & C10. Hydrocarbons C2, C4, C6, & C8 values are recorded and retained in the master data set, available to include graphically as warranted. The strip log format is scaled in ppm. C1-C2 are considered dry gas; C3-C4 are wetter gas; C5-C6 are gas condensate and C7-C10 are related to oil. Ratio comparison analysis of light vs. heavy hydrocarbons is useful in determining compartmentalization features, seals, depletions and light end enhancements. Heavier hydrocarbons are strongly influenced by diesel and certain mud additives. Methane is not appreciably contributed to by these same components. The evaluation of shows in OBM is greatly facilitated by the ability to compare the diesel-dominated C5 ~ C7 range to the relatively unaffected methane. Additionally, heavier hydrocarbons are compared to corresponding components elsewhere in the chemistry array to help in determining significance of indicated compounds (i.e. comparing benzene to cC6). Oil-Based Mud Crown GeoChemistry, Inc. Water-Based Mud Paraffin Ratio Interpretation usage guide This ratio column is used to establish the hydrocarbon characteristics. The curves are not interpreted with respect to gas volumes but to the overall homogeneity of gas type. Diesel or Oil-based mud systems can severely affect this data. Paraffin ratios (R1, R2, and R3) are light, mid-range, and heavy hydrocarbons as a ratio to methane and propane. The ratios are useful as they are less dependent on component gas volumes. The base of significant gas contribution is often indicated in one or more of these curves. This helps to establish the actual pay section interval in zones which have continued higher gas values below the show interval. Encountered contribution is seen as the methane-dominated influx into the slightly less methane-rich background which causes the ratios to shift (typically left). The return from this new value happens as measured gas returns to the methane poorer influence of typical background gas. The inflection points of the ratio curve(s) (whether dip or bulge) during a gas event are often very clear and can serve to reliably mark the source interval. In a gas show, higher values tend to indicate relatively wetter gas. Conversely, relatively low values indicate dry gas. Look for these curves to drive hard to the baseline in methane gas shows. Crown GeoChemistry, Inc. Class Ratio Interpretation usage guide This ratio column is used to establish the hydrocarbon characteristics. The curves are not interpreted with respect to gas volumes but to the overall homogeneity of gas type. Diesel or Oil-based mud systems can severely affect this data. Class curves use ratios of aromatic, naphthenic, and paraffin compounds, each against all. These are useful primarily to help determine geological boundaries, tops, faults, etc. Be cautious of trip effects, sample efficiency problems (such as severe changes in surface or mud conditions), extractor setup changes and other time-related chemistry drift, as this can affect the curve distribution. The use of these three ratio curves in conjunction with each other follows the basic premise that pore fluids in between two sealing boundaries should mix fairly effectively over time. Some variance for certain sorting of chemistry due to effects of physics-related influences (fluid densities, etc) should be kept in mind. When one or all of these curves has a notable shift in the mean trend, the interpretation is that new geochemistry is encountered. Minor erratic line movement is typical and ignored. A careful look at changes in the general chemistry trends across the rest of the log should be used to help endorse the geologic boundary determination. This over-all general trend examination can also help in any attempt to determine how similar two units may be with respect to source and migration, and may or may not indicate the possibility of communication between two zones. Crown GeoChemistry, Inc. Information Column Interpretation usage guide This column includes information like Bit Trips, Rig Downtimes, Compartment Boundaries, Fault/Frac markers, Strategraphic tops (if provided), or any other relevant information that needs to be noted. Crown GeoChemistry, Inc. Water Solubles Interpretation usage guide We use three curves that are indicative of water-soluble hydrocarbon compounds. Sol 1 – Ratio of Benzene to Toluene. (red curve). Sol 2 – Quantity of Benzene (blue curve). Sol 5 – Ratio of Benzene/cC6 (purple curve). These three curves indicate the presence of compounds which are inherently prone to stay dissolved, once dissolved in water. In porous zones, the interpretation of the presence of these compounds would indicate fluid contacts, and/or bypassed pay. In relatively non-porous zones (like mature source rock shales) the presence of these compounds is more likely attributable to hydrocarbon richness and water content of that geological feature. The ratio of Benzene to cC6 (Sol 5) is compared to the amount of benzene to indicate oil shows without associated water. Benzene might be part of the natural hydrocarbon spread in a zone with in-place gas liquids. Absolute and scaled covariance of the two in wet (hydrocarbon-rich) gas background would counter-indicate Sw, while activity in benzene uncorrelated to C6 would tend to indicate Sw, especially if endorsed by concurrent presence of other water solubles. Crown GeoChemistry, Inc. Inorganic Compounds Interpretation usage guide Inorganic compounds are useful in determining areas that have increased porosity and/or permeability. Helium is especially useful in determining possible frac/fault affected areas due to the properties of helium and how it travels through the subsurface. Helium is a noble gas (basically non-reactive and insoluble), and it is small. A fairly effective seal could provide a moderate trap for Helium to accumulate behind and slowly leak through. This would indicate a lower poro/perm zone. Hydrogen and methane can also be effective porosity indicators. Inorganic compounds are also useful in determining compartmental differences within a well. Crown GeoChemistry, Inc. Atmospherics Interpretation usage guide This displays the quantity of the most abundant atmospheric constituents. The use of these curves is primarily used for quality control in sampling. Crown GeoChemistry, Inc. Norm Curves Interpretation usage guide This track contains two data curves based on C1 (blue) and C4 (orange)from the Path Plot presentation. The curve scales are set with C1 having it’s max sustained value for the well as full scale, and C4 set in similar fashion. C4 is often then adjusted so that the largest portion of the curve is set to match the C1 span. The C1 and C4 values used for these curves are normalized values. We normalize for volume so that we can look at data without looking through artifacts of the drilling rig or drilling process. The concept is simple enough. We take a wet hydrocarbon (generally C7) and we determine a median value for it to use as the target value. For every data point the C7 gets pushed up or down so that it’s value becomes equal to the target value. This essentially makes C7 a straight line. Whatever correction is required to make the C7 adjustment to a straight line is then also applied to C1 and C4. This is a highly effective way to estimate the approximate gas volumes without drilling artifacts. Nothing about this analysis hinges on this conversion. The conversion makes the data easier to see in some cases. In less problematic data sets the conversion is hardly discernible from simply using raw C1 and C4 numbers. Crown GeoChemistry, Inc.


