p 2 - Barley World
advertisement
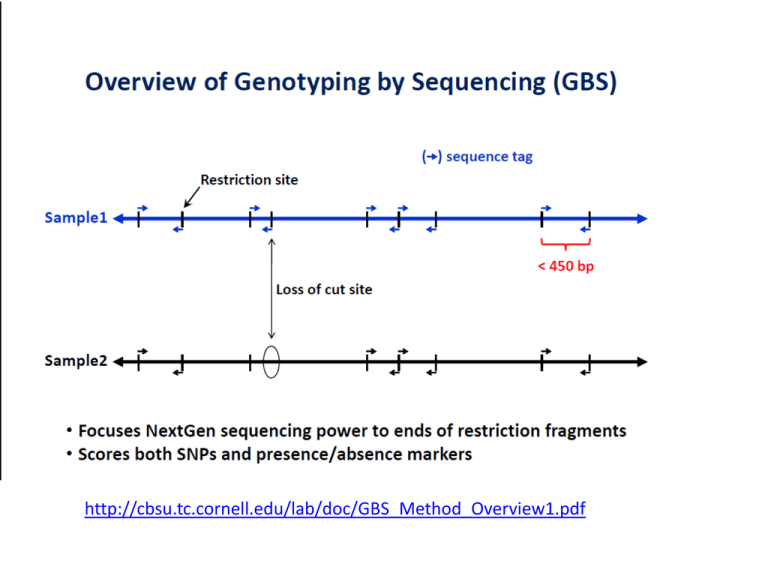
http://cbsu.tc.cornell.edu/lab/doc/GBS_Method_Overview1.pdf RADseq: Restriction-site Associated DNA markers • Uses Illumina sequencing technology • Based on digestion with restriction enzymes. An adapter binds to the restriction site and up to 5kb fragments are sequenced around the target size. • Bioinformatics work used to find SNPs on the amplified regions 72.4 73.6 74.9 76.1 78.6 82.4 83.6 84.9 86.1 88.6 91.1 92.3 94.8 97.3 98.6 102.4 103.6 104.8 108.6 109.9 112.4 113.6 114.8 117.3 118.6 119.8 122.3 126.1 132.6 133.8 137.6 140.1 141.4 143.9 146.4 147.6 148.8 151.3 153.8 155.1 156.3 158.8 160.1 168.0 169.2 170.4 171.7 scssr00334 3_0245 FGX_OWB00313 FGX_OWB00072 1_0436 1_0640 1_0632 FGX_OWB00365 2_0374 1_1430 3_1252 2_0442 2_1476 1_1316 3_1256 ABG356 bPb-4837 GBM1023 1_1347 3_1307 2_1094 1_1072 bPb-6437 bPb-0885 bPb-7256 FGX_OWB00227 bPb-4040 bPb-5440 [222771] 1_1096 bPb-9754 bPb-6088 3_0205 3_1021 1_0407 bPb-8100 bPb-7243 2_0833 2_0528 2_0667 1_1402 FGX_OWB00003 3_1394 FGX_OWB00079 3_0178 scsnp03343 [222968] 1_1388 3_1445 1_0786 1_0859 1_1100 FGX_OWB00337 3_0900 1_1533 3_0897 2_0340 3_0901 vrs1 1_0936 1_0969 2_1351 2_0793 FGX_OWB00508 FGX_OWB00026 Bmag0125 DsT-41 FGX_OWB00273 MWG503 bPb-3563 3_0216 bPb-7991 1_1307 bPb-6194 bPb-4835 2_1007 1_1285 bPb-1926 GBM1062 FGX_OWB00074 FGX_OWB00022 KFP203 2_0923 MWG882A 1_0398 3_0200 FGX_OWB00526 2_1527 1_1466 1_0900 3_0095 3_0480 3_0049 bPb-8737 bPb-3653 3_0555 1_1323 bPb-4577 bPb-1772 1_1094 bPb-6822 FGX_OWB00464 FGX_OWB00183 FGX_OWB00047 FGX_OWB00209 2_1238 1_0263 bPb-3870 3_1402 bPb-8274 1_1043 bPb-2481 2_0064 1_0990 1_0989 1_0128 FGX_OWB00299 2_0955 FGX_OWB00060 ABG072 [223776] 1_1236 1_0707 3_0459 1_0429 2_0989 FGX_OWB00055 1_0739 FGX_OWB00173 1_0780 3_1406 bPb-1266 bPb-8949 1_1365 bPb-7992 3_0097 bPb-0541 3_0152 2_0141 [221435] 2_1315 bPb-6688 3_1100 1_0109 2_1459 [222960] 1_1486 3_0695 3_0041 1_0446 3_0310 2_1406 FGX_OWB00343 Ebmc0415 FGX_OWB00238 FGX_OWB00123 FGX_OWB00181 cnx1 bPb-2971 bPb-5412 FGX_OWB00011 [222464] 2_0215 1_0065 2_1125 2_1336 1_0383 1_0472 bPb-3858 3_0678 1_1227 FGX_OWB00198 bPb-1505 [221983] 3_0106 3_0396 Zeo1 3_0248 2_0590 2_1181 [223553] FGX_OWB00152 bPb-0303 1_0315 bPb-4092 1_0566 bPb-1986 1_1023 bPb-5619 bPb-1184 bPb-5460 [221407] bPb-1815 bPb-7208 bPb-8530 bPb-1566 GBM1019 FGX_OWB00229 FGX_OWB00377 2_0943 3_0823 FGX_OWB00099 Aglu4 FGX_OWB00322 FGX_OWB00132 Aglu5 FGX_OWB00312 MORPHOLOGICAL RFLP SSR STS DArT SNP RAD Marker Usefulness • Informativeness - measured by the number of alleles and allele frequencies – heterozygosity (H) – polymorphic information content (PIC) • Throughput - multiplex ratio (number of simultaneously assayed loci) • Utility – reproducibility of the marker assay – clarity of the marker genotypes Heterozygosity or Gene/Marker Diversity k H 1 p i 1 2 i pi is the frequency of the ith allele k is the No. of alleles (Nei 1973) Outbred population • H estimates the probability that a randomly sampled individual is heterozygous Inbred population • H estimates the probability that a randomly sampled pair of lines are homozygous for different alleles The Hardy-Weinberg Principle AA Aa Aa aa p1 (freq. of A) = 0.5 p2 (freq of a) = 0.5 p12 (freq. of AA) = 0.25 p22 (freq. of aa) = 0.25 2 p1 p2 (freq. of Aa) = 0.50 p12 + 2 p1 p2 + p22 = 1.00 freq. of homozygotes = p12 + p22 freq. of heterozygotes = 1 - (p12 + p22) k H 1 p i 1 2 i Examples ABO alleles in humans If p1 = 0.28 , p2 = 0.06 , and p3 = 0.66 H = 1 – (0.282 + 0.062 + 0.662) = 0.48 SSR markers in sunflower If p1 = 0.13 , p2 = 0.19 , p3 = 0.62 , and p4 = 0.06 H = 1 – (0.132 + 0.192 + 0.622 + 0.062) = 0.56 Heterozygosity No. Alleles Alleles 1 2 3 4 5 2 3 4 5 p1 1. 0 0.95 0.90 0.85 0.92 0.50 0.33 0.25 0.20 0.05 0.05 0.05 0.02 0.50 0.33 0.25 0.20 0.05 0.05 0.02 0.34 0.25 0.20 0.05 0.02 0.25 0.20 p2 p3 p4 p5 Heterozygosity for a genetic marker with k equally frequent alleles H 0.02 0. 0 0.10 0.19 0.27 0.15 0.20 0.50 0.67 0.75 0.80 Polymorphism Information Content (PIC) k 1 k k 1 k k PIC 1 p 2 p p H 2 p p i 1 2 i i 1 j i 1 2 i 2 j i 1 j i 1 (Botstein et al. 1980) 2 i 2 j pi is the frequency of the ith allele pj is the frequency of the jth allele k is the No. of alleles • A measure of the informativeness of a genetic marker for linkage analysis • Probability that a marker will be polymorphic in a set of untested genotypes H vs. PIC Heterozygocity and PIC for a genetic marker with k equally frequent alleles Mean Heterozygosity n H Hj /n j 1 Hj is the heterozygocity of the jth markers n is the No. of genetic markers Mean Heterozygosity • HT mean heterozygocity for polymorphic and monomorphic markers • Hp mean heterozygocity for polymorphic markers HT np n p nm np H j 1 np j / n p p H j / n p j 1 Hj is the heterozygocity of the jth markers np is the No. of polymorphic markers nm is the No. of monomorphic markers HT H When averaging over polymorphic and nonpolymorphic markers Mean number of polymorphic genetic markers per assay b P HT ( ma / b) m H T a 1 ma is the No. of bands produced by ath assay b is the No. of assays m is the mean No. of bands per assay HT is the mean heterozygosity • Product of the mean number of bands per assay and mean heterozygocity

