18-2 Modern Evolutionary Classification
Slide
1 of 24
Evolutionary
Classification
• Which Similarities Are Most Important?
– Linnaeus grouped species into larger taxa
mainly according to visible similarities and
differences.
– How are evolutionary relationships important
in classification?
Slide
2 of 24
Evolutionary
Classification
• Evolutionary Classification
• Phylogeny is the study of evolutionary
relationships among organisms.
Slide
3 of 24
Evolution
Classifica
– Biologists currently group organisms into
categories that represent lines of evolutionary
descent, or phylogeny, not just physical
similarities.
– The strategy of grouping organisms is
based on evolutionary history and is called
evolutionary classification.
Slide
4 of 24
Evolutionary
Classification
• The higher the level of the taxon, the
further back in time is the common
ancestor of all the organisms in the taxon.
• Organisms that appear very similar may
not share a recent common ancestor.
Slide
5 of 24
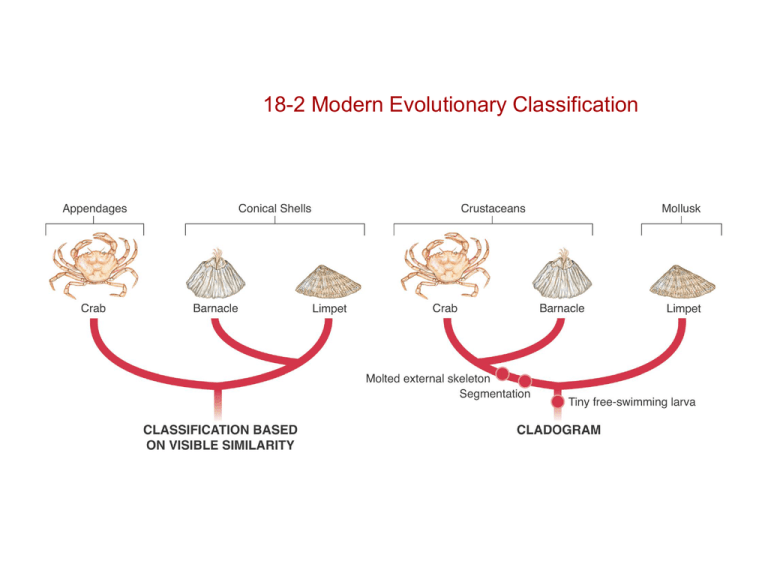
18-2 Modern Evolutionary Classification
Evolutionary
Classification
Different Methods of Classification
Appendages
Crab
Barnacle
Mollusk
Crustaceans
Conical Shells
Limpet
Crab
Barnacle
Molted external
skeleton
Segmentation
CLASSIFICATION BASED ON
VISIBLE SIMILARITY
Limpet
Tiny freeswimming larva
CLADOGRAM
Slide
6 of 24
Copyright Pearson Prentice Hall
Evolutionary
Classification
• Superficial similarities once led barnacles
Conical Shells
Appendagesto be grouped
and limpets
together.
Crab
Barnacle
Limpet
Slide
7 of 24
Evolutionary
Classification
• However, barnacles and crabs share an
evolutionary ancestor that is more recent
than the ancestor that barnacles and
limpets share.
• Barnacles and crabs are classified as
crustaceans, and limpets are mollusks.
Slide
8 of 24
Classification Using
Cladograms
• Classification Using Cladograms
• Many biologists now use a method called cladistic
analysis.
• Cladistic analysis identifies and considers only
new characteristics that arise as lineages evolve.
• Characteristics that appear in recent parts of a
lineage but not in its older members are called
derived characters.
Slide
9 of 24
Classification Using
Cladograms
• Derived characters can be used to
construct a cladogram, a diagram that
shows the evolutionary relationships
among a group of organisms.
• Cladograms help scientists understand
how one lineage branched from another in
the course of evolution.
Slide
10 of 24
Classification Using
Cladograms
• A cladogram shows the evolutionary
Crustaceans
relationships
between crabs, Mollusk
barnacles,
and limpets.
Crab
Barnacle
Limpet
Molted external skeleton
Segmentation
Tiny free-swimming larva
Slide
11 of 24
Similarities in DNA
and RNA
• Similarities in DNA and RNA
– How can DNA and RNA help scientists
determine evolutionary relationships?
Slide
12 of 24
DNA
and RN
– The genes of many organisms show
important similarities at the molecular level.
– Similarities in DNA can be used to help
determine classification and evolutionary
relationships.
Slide
13 of 24
Similarities in DNA
and RNA
– DNA Evidence
• DNA evidence shows evolutionary relationships of
species.
• The more similar the DNA of two species, the more
recently they shared a common ancestor, and the
more closely they are related in evolutionary terms.
• The more two species have diverged from each
other, the less similar their DNA will be.
Slide
14 of 24
Molecular Clocks
• Molecular Clocks
• Comparisons of DNA are used to mark the
passage of evolutionary time.
• A molecular clock uses DNA comparisons to
estimate the length of time that two species have
been evolving independently.
Slide
15 of 24
MolecularA gene
Clocks
in an
ancestral species
• Molecular Clock
2 mutations
new
mutation
Species
A
2 mutations
new
new
mutation mutation
Species
B
Species
C
Slide
16 of 24
Molecular Clocks
• A molecular clock relies on mutations to
mark time.
• Simple mutations in DNA structure occur
often.
• Neutral mutations accumulate in different
species at about the same rate.
• Comparing sequences in two species
shows how dissimilar the genes are, and
shows when they shared a common
ancestor.
Slide
17 of 24

