Exhibits -- Realizing Health Reform`s Potential
advertisement
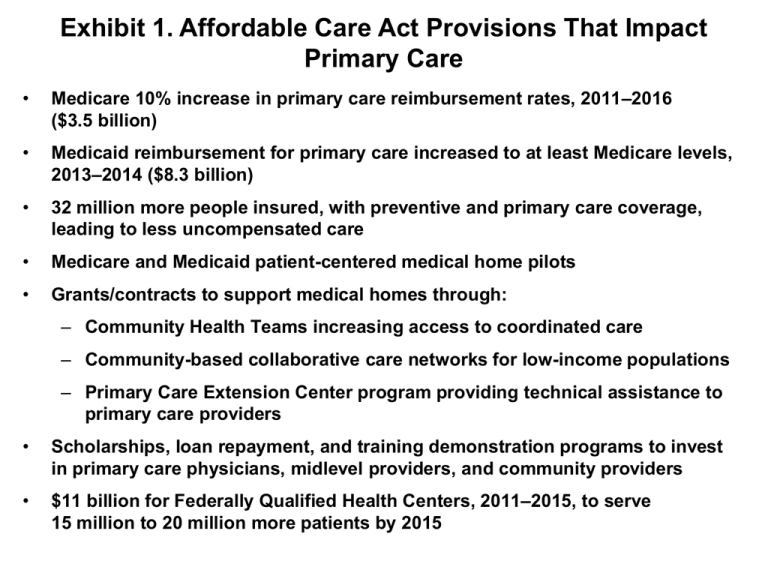
Exhibit 1. Affordable Care Act Provisions That Impact Primary Care • Medicare 10% increase in primary care reimbursement rates, 2011–2016 ($3.5 billion) • Medicaid reimbursement for primary care increased to at least Medicare levels, 2013–2014 ($8.3 billion) • 32 million more people insured, with preventive and primary care coverage, leading to less uncompensated care • Medicare and Medicaid patient-centered medical home pilots • Grants/contracts to support medical homes through: – Community Health Teams increasing access to coordinated care – Community-based collaborative care networks for low-income populations – Primary Care Extension Center program providing technical assistance to primary care providers • Scholarships, loan repayment, and training demonstration programs to invest in primary care physicians, midlevel providers, and community providers • $11 billion for Federally Qualified Health Centers, 2011–2015, to serve 15 million to 20 million more patients by 2015 Exhibit 2. Distribution of Primary Care Physicians, by Practice Size (number of physicians) 11 or more physicians 7% Solo practice 32% 2 physicians 14% 6–10 physicians 15% 3–5 physicians 32% Source: T. Bodenheimer and H. H. Pham, “Primary Care: Current Problems and Proposed Solutions,” Health Affairs, May 2010 29(5):799–805. THE COMMONWEALTH FUND Exhibit 3. U.S. Primary Care Doctors’ Reports of Financial Incentives Targeted on Quality of Care Percent of U.S. physicians reporting they receive or have potential to receive extra payment based on quality 28 Achieving certain clinical care targets 19 High ratings for patient satisfaction 17 Managing patients with chronic disease/complex needs 10 Enhanced preventive care activities 7 Non-face-to-face patient interactions 6 Adding nonphysician clinicians to team 36 Any targeted care or meeting goals (US) * 58 Any targeted care or meeting goals (Germany) * 89 Any targeted care or meeting goals (UK) * 0 25 50 75 * Can receive financial incentives for any of six: high patient satisfaction ratings, achieve clinical care targets, managing patients with chronic disease/complex needs, enhanced preventive care (includes counseling or group visits), adding nonphysician clinicians to practice and non–face-to-face interactions with patients. Source: 2009 Commonwealth Fund International Health Policy Survey of Primary Care Physicians. 100 THE COMMONWEALTH FUND Exhibit 4. The Primary Care–Specialty Income Gap Is Widening Median pretax compensation of physicians, 1995–2004 All Primary Care All Specialists $350,000 $297,000 $300,000 $250,000 37.5% increase $215,978 $200,000 $150,000 $161,816 $133,329 21.4% increase $100,000 $50,000 $0 1995 2000 2004 Source: T. Bodenheimer, R. A. Berenson and P. Rudolf, “The Primary Care–Specialty Income Gap: Why It Matters,” Annals of Internal Medicine, Feb. 2007 146(4):301–06. THE COMMONWEALTH FUND Exhibit 5. Timeline for Implementation of Primary Care Provisions in the Affordable Care Act • Student loan support to strengthen the health care workforce: - primary care student loans - nursing student loans - pediatric health care workforce student loans • Increased Medicare reimbursement (10%) for primary care services • Additional funding • State option to for Community allow Medicaid • Health Centers and beneficiaries with the National Health chronic conditions Service Corps to designate a begins health home • Preventive services coverage without costsharing 2010 • Medicaid primary care provider payment rates set no lower than Medicare rates • Grants to develop community-based collaborative care networks Medicare demonstration program to test payment incentives and delivery system models that utilize homebased primary care teams 2011 2012 • Preventive service coverage for adult Medicaid beneficiaries without costsharing increases federal Medicaid assistance percentages • Grants for states to establish primary care extension centers 2013 Source: Commonwealth Fund Analysis of the Affordable Care Act (Public Law 111-148 and 111-152). • Qualified health plans offering in the exchanges must include federally qualified health centers in covered networks and reimburse at minimum of Medicaid rates • HHS grants or contracts to establish community health teams to support patient-centered medical homes 2014–2017 Exhibit 6. Wide Variation in Medicaid-to-Medicare Fee Ratio for All Primary Care Services, 2008 State Ratio State Ratio State Ratio Alabama 0.78 Kentucky 0.80 North Dakota 1.01 Alaska 1.40 Louisiana 0.90 Ohio 0.66 Arizona 0.97 Maine 0.53 Oklahoma 1.00 Arkansas 0.78 Maryland 0.82 Oregon 0.78 California 0.47 Massachusetts 0.78 Pennsylvania 0.62 Colorado 0.87 Michigan 0.59 Rhode Island 0.36 Connecticut 0.78 Minnesota 0.58 South Carolina 0.86 Delaware 1.00 Mississippi 0.84 South Dakota 0.85 District of Columbia 0.47 Missouri 0.65 Tennessee N/A Florida 0.55 Montana 0.96 Texas 0.68 Georgia 0.86 Nebraska 0.82 Utah 0.76 Hawaii 0.64 Nevada 0.93 Vermont 0.91 Idaho 1.03 New Hampshire 0.67 Virginia 0.88 Illinois 0.57 New Jersey 0.41 Washington 0.92 Indiana 0.61 New Mexico 0.98 West Virginia 0.77 Iowa 0.89 New York 0.36 Wisconsin 0.67 Kansas 0.94 North Carolina 0.95 Wyoming 1.17 Source: Adapted from S. Zuckerman, A. F. Williams, and K. E. Stockley, “Trends in Medicaid Physician Fees, 2003–2008," Health Affairs Web Exclusive, April 28, 2009, w510–w519. Exhibit 7. Uninsured Rate Among Adults Ages 19–64, 2008–09 and 2019 2019 (estimated) 2008–09 WA VT NH ME MT NH WA ND VT OR ID NY WI SD MI WY PA IA NE UT OH IN NV CA IL CO MA KS MO WV VA KY NJ RI CT MN OR ID PA IA IL CO KS MO AZ NM MS TX AL DE MD DC NC AZ GA NM OK SC AR MS LA TX AL GA LA FL AK VA NJ RI CT TN SC AR WV KY TN OK OH IN NV CA MA MI NE UT NY WI SD WY DE MD DC NC ME ND MT MN FL AK HI HI 23% or more 19%–22.9% 7.1%–13.9% 14%–18.9% 7% or less Data: U.S. Census Bureau, 2009–10 Current Population Survey ASEC Supplement; estimates for 2019 by Jonathan Gruber and Ian Perry of MIT using the Gruber Microsimulation Model for The Commonwealth Fund. Source: Commonwealth Fund State Scorecard on Child Health System Performance, forthcoming 2011. THE COMMONWEALTH FUND Exhibit 8. Impact of Medical Homes on Quality of Care Percent of adults reporting Has medical home 100 No medical home 76 72 75 63 61 55 47 50 34 29 25 16 21 0 Very/somewhat difficult to get offhours care outside the ER Medical records not Experienced Doctor gives written Receive reminder for available or medical, medication, plan for managing preventive/follow-up duplicated or lab error care at home care Adults with a chronic condition Note: Medical home includes having a regular provider that knows you, is easy to contact, and coordinates your care. Errors include medical mistake, wrong medication/dose, or lab/diagnostic errors. Source: 2007 Commonwealth Fund International Health Policy Survey. Data collection: Harris Interactive, Inc. THE COMMONWEALTH FUND Exhibit 9. Opportunities in the Affordable Care Act for Federally Qualified Health Centers • Eleven billion dollars provided over five years to expand the federally qualified health center (FQHC) program beyond amounts previously appropriated. • New teaching health center grant program to support new or expanded primary care residency programs at FQHCs, with $125 million authorized for fiscal years 2010–12, and $230 million additional funding to cover direct and indirect expenses of teaching health centers to train primary care residents in expanded or new programs. • Loan forgiveness for pediatric subspecialists and mental or behavioral health service providers working with children and adolescents in a federally designated health professional shortage area, medically underserved area, or areas with a medically underserved population. • Training/workforce development, including demonstration grants for family nurse practitioner training programs supporting providers in FQHCs. • Grants to FQHCs to promote positive health behaviors and outcomes in medically underserved areas through the use of community health workers. • Essential health benefits requirement for insurance plans offered in the new health insurance exchanges will ensure that networks of preferred providers include FQHCs, and that payments by qualified health plans to FQHCs are at least as high as the payments under Medicaid. • New prospective payment system for Medicare-covered services furnished by FQHCs, including preventive services, with $400 million in expected additional revenues for health centers. THE COMMONWEALTH Source: L. Ku, P. Richard, A. Dor et al., Strengthening Primary Care to Bend the Cost Curve: The Expansion of Community Health Centers Through FUND Health Reform (Washington, D.C.: George Washington University School of Public Health and Health Services, June 30, 2010, available at http://www.gwumc.edu/sphhs/departments/healthpolicy/dhp_publications/pub_uploads/dhpPublication_895A7FC0-5056-9D20-3DDB8A6567031078.pdf. Exhibit 10. Affordable Care Act and Primary Care: Impact of Selected Provisions on Patients and Providers • Fifty million Medicare beneficiaries in 2011 will have free access to currently covered preventive services, such as high-blood-pressure screening, alcohol misuse counseling, and colon cancer screening. • Up to 40 million people in 2011 and 90 million by 2013 will no longer have to make a copayment for recommended preventive screenings, including cancer screenings. • Nearly 40 million Medicaid enrollees in 2013 will have access to free preventive care services. • In 2011, 50 million Medicare seniors will be eligible for free annual wellness check-ups and personalized prevention plans. • A 10 percent bonus will be paid to primary care practitioners who see Medicare patients (2011–2015). • Payment rates for primary care physicians who see Medicaid patients will be increased (2013–2014). • Starting in 2011, as many as 10 million Medicaid patients who have at least one chronic condition could have a “health home” to help them manage their condition. An estimated 8 million newly eligible Medicaid beneficiaries with at least one chronic condition could have a health home by 2014. • The Affordable Care Act and the American Recovery and Reinvestment Act (the so-called stimulus package) will together support the training of more than 16,000 new primary care providers over the next five years. THE COMMONWEALTH FUND
