Nutrient uptake and use
advertisement
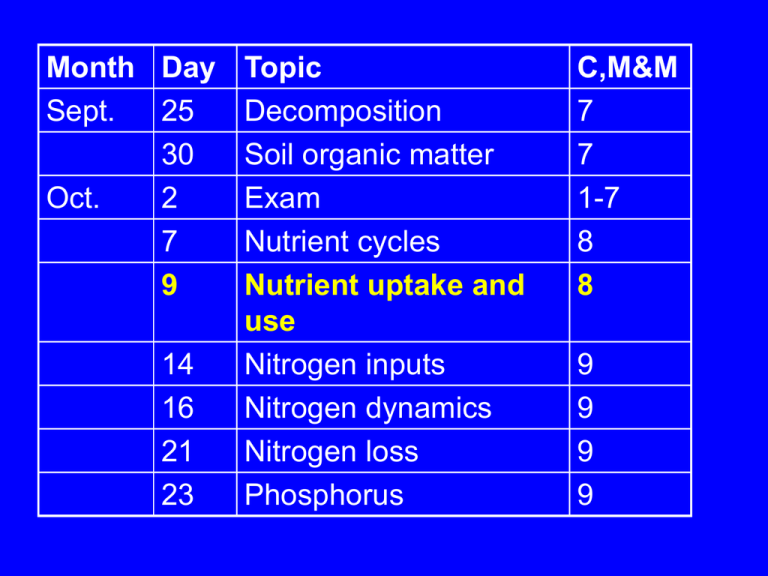
Month Day Topic Sept. 25 Decomposition 30 Soil organic matter Oct. 2 Exam 7 Nutrient cycles 9 Nutrient uptake and use 14 Nitrogen inputs 16 Nitrogen dynamics 21 Nitrogen loss 23 Phosphorus C,M&M 7 7 1-7 8 8 9 9 9 9 Plant nutrient uptake and use 4. Use 3. Loss 2. Uptake 1. Movement to the root 1. Nutrient movement to the root: diffusion and mass flow • Diffusion is most important for N (NO3-), P, K • Mass flow is most important for Ca, Mg, S, micronutrients • Root interception is not important 2. Nutrient uptake • Active transport moves ions across root cell membranes Up a concentration gradient Ion specific carriers Large component of root respiration 2. Nutrient uptake • Controlled by supply rate at “steady state” • After disturbance, controlled by root length and root activity • Enhanced by mycorrhizae 2. Nutrient uptake: Mycorrhizae • 80% angiosperms, all gymnosperms • C exchanged for nutrients (4-20% GPP) • Extend root surface into bulk soil • Increase surface area • Diffusion through mycorrhizae more rapid than through soil water Ectos, AM, ericoid, orchid 2. Nutrient uptake • Form • NH4+, NO3- , Amino acids • PO42- 2. Nutrient uptake • Plant demand for nutrients increases allocation to nutrient uptake • Increase specific root length • Increase density of ion carriers • C investment in mycorrzhiae • But at an ecosystem scale, nutrient supply is the ultimate constraint on nutrient uptake Plant nutrient uptake and use 4. Use 3. Loss 2. Uptake 1. Movement to the root 3. Nutrient Loss • Litterfall > leaching > herbivory > exudates • Plants resorb 0-90% of N&P at leaf senescence (roots? wood?) • Resorption is not clearly linked to plant nutrient status (but is to water status) • Resorption is sometimes linked to growthform 4. Plant nutrient use (THINK: difference between uptake and loss) • Nutrient supply effects growth more than it effects nutrient concentration • Plant nutrient use efficiency: • Biomass produced per unit nutrient • Mean residence time of nutrient Plant NUE = N productivity x N Turnover Time A* Tn 4. Plant nutrient use • Infertile sites • N TT x N productivity • Fertile sites • TT x N productivity • Result: Less difference in NUE across fertility gradients than you would expect given nutrient supply rates 5. Ecosystem NUE • Ratio of biomass:N lost in litterfall (Vitousek 1982) • Greatest where production is nutrient limited • Plants maximize Ecosystem NUE in poor soils by reducing nutrient loss through longer-lived tissues, not through increased resorption Vitousek 1982 Plant nutrient uptake and use 4. Use 3. Loss 2. Uptake 1. Movement to the root


