poster_Sylwester_Przybyl
advertisement
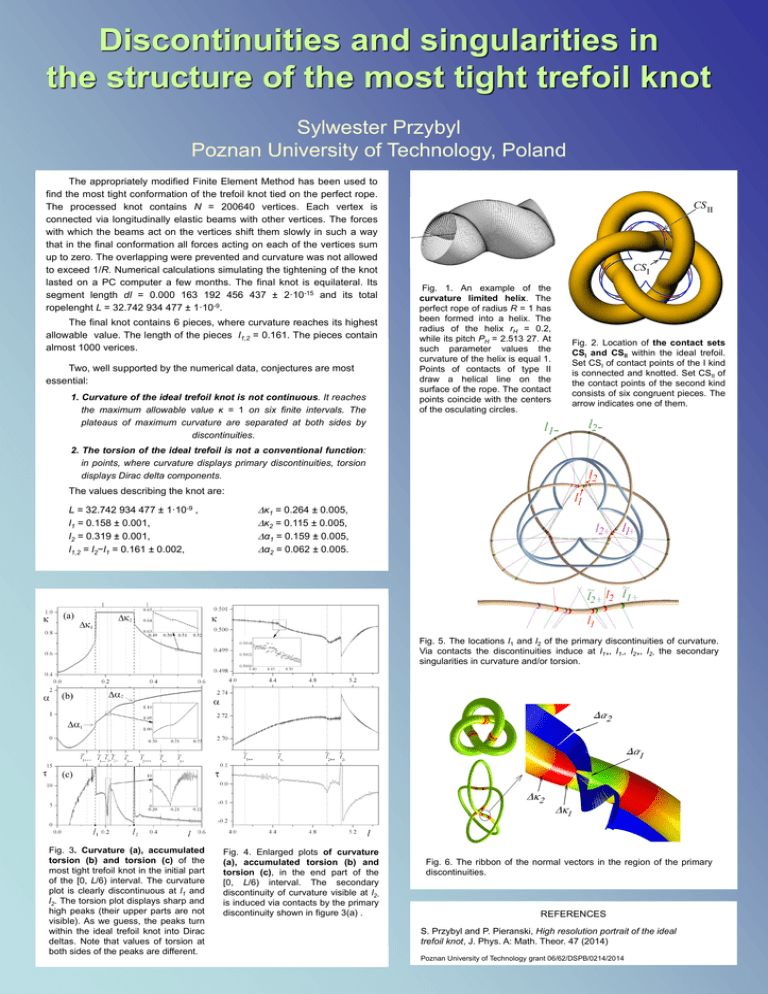
Discontinuities and singularities in the structure of the most tight trefoil knot Sylwester Przybyl Poznan University of Technology, Poland The appropriately modified Finite Element Method has been used to find the most tight conformation of the trefoil knot tied on the perfect rope. The processed knot contains N = 200640 vertices. Each vertex is connected via longitudinally elastic beams with other vertices. The forces with which the beams act on the vertices shift them slowly in such a way that in the final conformation all forces acting on each of the vertices sum up to zero. The overlapping were prevented and curvature was not allowed to exceed 1/R. Numerical calculations simulating the tightening of the knot lasted on a PC computer a few months. The final knot is equilateral. Its segment length dl = 0.000 163 192 456 437 ± 2·10-15 and its total ropelenght L = 32.742 934 477 ± 1·10-9. The final knot contains 6 pieces, where curvature reaches its highest allowable value. The length of the pieces l1,2 = 0.161. The pieces contain almost 1000 verices. Two, well supported by the numerical data, conjectures are most essential: 1. Curvature of the ideal trefoil knot is not continuous. It reaches the maximum allowable value κ = 1 on six finite intervals. The plateaus of maximum curvature are separated at both sides by discontinuities. Fig. 1. An example of the curvature limited helix. The perfect rope of radius R = 1 has been formed into a helix. The radius of the helix rH = 0.2, while its pitch PH = 2.513 27. At such parameter values the curvature of the helix is equal 1. Points of contacts of type II draw a helical line on the surface of the rope. The contact points coincide with the centers of the osculating circles. Fig. 2. Location of the contact sets CSI and CSII within the ideal trefoil. Set CSI of contact points of the I kind is connected and knotted. Set CSII of the contact points of the second kind consists of six congruent pieces. The arrow indicates one of them. 2. The torsion of the ideal trefoil is not a conventional function: in points, where curvature displays primary discontinuities, torsion displays Dirac delta components. The values describing the knot are: L = 32.742 934 477 ± 1·10-9 , l1 = 0.158 ± 0.001, l2 = 0.319 ± 0.001, l1,2 = l2−l1 = 0.161 ± 0.002, Dκ1 = 0.264 ± 0.005, Dκ2 = 0.115 ± 0.005, Dα1 = 0.159 ± 0.005, Dα2 = 0.062 ± 0.005. Fig. 5. The locations l1 and l2 of the primary discontinuities of curvature. Via contacts the discontinuities induce at l1+, l1-, l2+, l2- the secondary singularities in curvature and/or torsion. Fig. 3. Curvature (a), accumulated torsion (b) and torsion (c) of the most tight trefoil knot in the initial part of the [0, L/6) interval. The curvature plot is clearly discontinuous at l1 and l2. The torsion plot displays sharp and high peaks (their upper parts are not visible). As we guess, the peaks turn within the ideal trefoil knot into Dirac deltas. Note that values of torsion at both sides of the peaks are different. Fig. 4. Enlarged plots of curvature (a), accumulated torsion (b) and torsion (c), in the end part of the [0, L/6) interval. The secondary discontinuity of curvature visible at l2is induced via contacts by the primary discontinuity shown in figure 3(a) . Fig. 6. The ribbon of the normal vectors in the region of the primary discontinuities. REFERENCES S. Przybyl and P. Pieranski, High resolution portrait of the ideal trefoil knot, J. Phys. A: Math. Theor. 47 (2014) Poznan University of Technology grant 06/62/DSPB/0214/2014
