The Effects of an Automatic Low Pressure Ventilation Device versus Manual Ventilation
During Cardiopulmonary Resuscitation in a Porcine Model of Cardiac Arrest
Xudong Hu, MD; Gabriel Laurent, MD; Petsy Pui-Sze So, BSc; Suzan O'Donnell, MS; Paul Dorian, MD, FRCPC
Cardiology Division, Department of Medicine, St. Michael’s Hospital, University of Toronto, Ontario, Canada
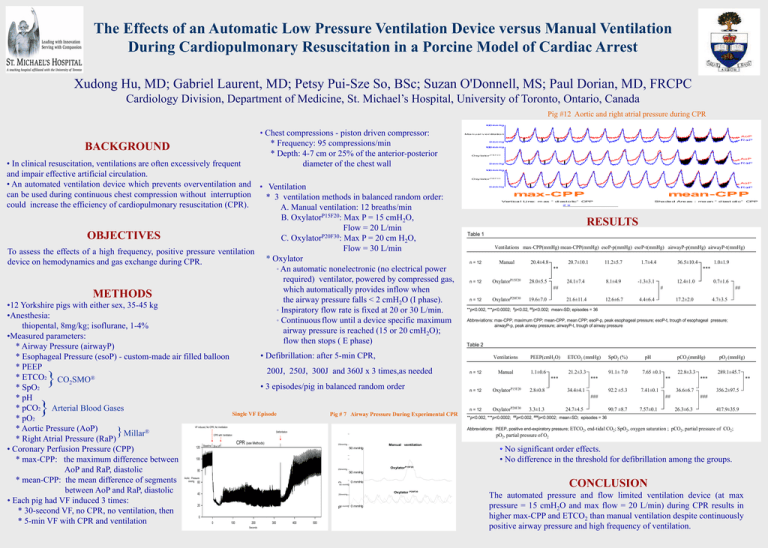
Pig #12 Aortic and right atrial pressure during CPR
• Chest compressions - piston driven compressor:
* Frequency: 95 compressions/min
* Depth: 4-7 cm or 25% of the anterior-posterior
diameter of the chest wall
BACKGROUND
• In clinical resuscitation, ventilations are often excessively frequent
and impair effective artificial circulation.
• An automated ventilation device which prevents overventilation and • Ventilation
can be used during continuous chest compression without interruption
* 3 ventilation methods in balanced random order:
could increase the efficiency of cardiopulmonary resuscitation (CPR).
A. Manual ventilation: 12 breaths/min
P15F20
B. Oxylator
: Max P = 15 cmH2O,
Flow = 20 L/min
P20F30
OBJECTIVES
C. Oxylator
: Max P = 20 cm H2O,
Flow
=
30
L/min
To assess the effects of a high frequency, positive pressure ventilation
*
Oxylator
device on hemodynamics and gas exchange during CPR.
° An automatic nonelectronic (no electrical power
required) ventilator, powered by compressed gas,
which automatically provides inflow when
METHODS
the airway pressure falls < 2 cmH2O (I phase).
•12 Yorkshire pigs with either sex, 35-45 kg
° Inspiratory flow rate is fixed at 20 or 30 L/min.
•Anesthesia:
° Continuous flow until a device specific maximum
thiopental, 8mg/kg; isoflurane, 1-4%
airway pressure is reached (15 or 20 cmH2O);
•Measured parameters:
flow then stops ( E phase)
* Airway Pressure (airwayP)
• Defibrillation: after 5-min CPR,
* Esophageal Pressure (esoP) - custom-made air filled balloon
* PEEP
200J, 250J, 300J and 360J x 3 times,as needed
* ETCO2 CO SMO®
2
• 3 episodes/pig in balanced random order
* SpO2
* pH
* pCO2 Arterial Blood Gases
Single VF Episode
Pig # 7 Airway Pressure During Experimental CPR
* pO2
* Aortic Pressure (AoP)
}
Millar®
* Right Atrial Pressure (RaP)
CPR (see Methods)
120
• Coronary Perfusion Pressure (CPP)
100
* max-CPP: the maximum difference between
80
AoP and RaP, diastolic
* mean-CPP: the mean difference of segments
60
Airway P
between AoP and RaP, diastolic
40
• Each pig had VF induced 3 times:
20
Airway P
* 30-second VF, no CPR, no ventilation, then
0
* 5-min VF with CPR and ventilation
0
100
200
300
400
500
}
}
VF induced, No CPR, No Ventilation
Defibrillation
CPR with Ventilation
25mmHg
Baseline 30-s VF
Manual ventilation
50 mmHg
Ma n u a l v e n tila tio n
Oxy la to r P15 F 2 0
Oxy la to r P20 F 3 0
max-CPP
Vert ica l Li ne: m ax “ di ast o lic”
mean-CPP
CPP
Sha de d Are as : me an “ d iast oli c”
RESULTS
Table 1
Ventilations max-CPP(mmHg) mean-CPP(mmHg) esoP-p(mmHg) esoP-t(mmHg) airwayP-p(mmHg) airwayP-t(mmHg)
n = 12
Manual
20.4±4.8
20.7±10.1
11.2±5.7
1.7±4.4
36.5±10.4
**
n = 12
OxylatorP15F20
***
28.0±5.5
24.1±7.4
8.1±4.9
-1.3±3.1
##
n = 12
OxylatorP20F30
1.0±1.9
12.4±1.0
0.7±1.6
#
19.6±7.0
21.6±11.4
12.6±6.7
##
4.4±6.4
17.2±2.0
4.7±3.5
**p<0.002, ***p<0.0002; #p<0.02, ##p<0.002; mean±SD; episodes = 36
Abbreviations: max-CPP, maximum CPP; mean-CPP, mean CPP; esoP-p, peak esophageal pressure; esoP-t, trough of esophageal pressure;
airwayP-p, peak airway pressure; airwayP-t, trough of airway pressure
Table 2
Ventilations
n = 12
Manual
PEEP(cmH2O)
ETCO2 (mmHg)
SpO2 (%)
1.1±0.6
21.2±3.3
91.1± 7.0
***
n = 12
OxylatorP15F20
2.8±0.8
pH
7.65 ±0.1
***
34.4±4.1
OxylatorP20F30
**p<0.002, ***p<0.0002;
3.3±1.3
92.2 ±5.3
##p<0.002, ###p<0.0002;
24.7±4.5
pO2 (mmHg)
22.8±3.3
289.1±45.7
**
7.41±0.1
###
n = 12
pCO2(mmHg)
***
36.6±6.7
##
90.7 ±8.7
7.57±0.1
**
356.2±97.5
###
26.3±6.3
417.9±35.9
mean±SD; episodes = 36
Abbreviations: PEEP, positive end-expiratory pressure; ETCO2, end-tidal CO2; SpO2, oxygen saturation ; pCO2, partial pressure of CO2;
pO2, partial pressure of O2
• No significant order effects.
• No difference in the threshold for defibrillation among the groups.
OxylatorP15F20
25mmHg
50 mmHg
Aortic Pressure
mmHg
0 mmHg
50 mmHg
Oxylator
25mmHg
Airway P
0 mmHg
0 mmHg
Seconds
2s
2s
P20F30
CPP
CONCLUSION
The automated pressure and flow limited ventilation device (at max
pressure = 15 cmH2O and max flow = 20 L/min) during CPR results in
higher max-CPP and ETCO2 than manual ventilation despite continuously
positive airway pressure and high frequency of ventilation.

