Quadratic Regression
advertisement
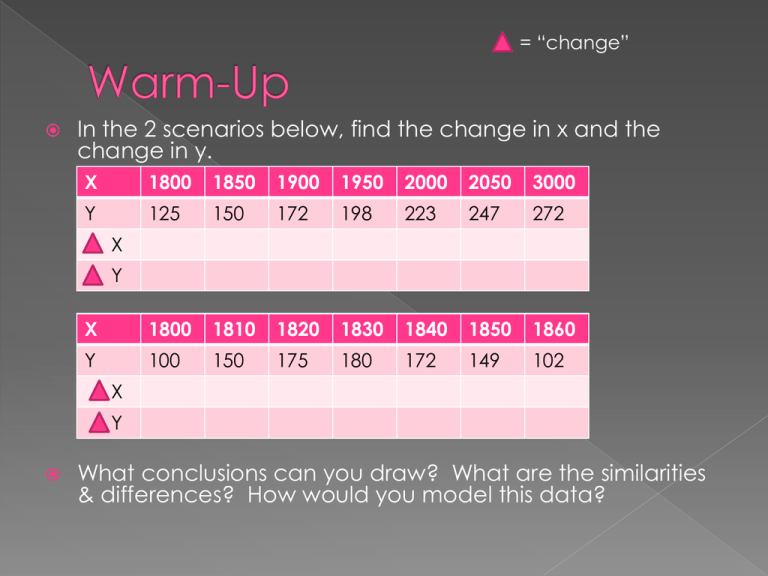
= “change” In the 2 scenarios below, find the change in x and the change in y. X 1800 1850 1900 1950 2000 2050 3000 Y 125 150 172 198 223 247 272 X 1800 1810 1820 1830 1840 1850 1860 Y 100 150 175 180 172 149 102 X Y X Y What conclusions can you draw? What are the similarities & differences? How would you model this data? So far, the data we have worked with has a linear relationship We have discussed 3 forms of linear modeling: › Best Fit line › Least Squares Regression Line › Median-Median line The data we have used has a linear relationship. This means that the rate of change (the slope) is constant. For linear data, every increase in the independent variable (X) has a constant increase in the dependent variable (Y). Slope = y = constant x Data does not always follow a linear model. Data may increase sharply, reach a maximum, then decline. Or, it may decrease sharply, reach a minimum, then increase again. The data in the graph at the right is shaped like a parabola – so it would follow a quadratic model instead of a linear model. Recall that parabolas are graphs of quadratic equations. They follow the model of y = ax2 + bx +c. › If a > 0, the parabola opens up (smiling) › If a < 0, the parabola opens down (frowning) Real-life examples of data that follows a quadratic pattern include: › Stock market (Peaks and Valleys) › Disease outbreaks (Black Plague, Polio, AIDS) › Particle motion (Ball trajectory, Draining water) Data can also follow an exponential model. Exponential data either › Increases exponentially, where the change in y continues to increase for each change in x OR › Decreases exponentially, where the change in y continues to decrease for each change in x. Examples of Real-Life data that follows an exponential model include: › Population growth (increasing) › National Debt (increasing) › Radioactive Decay (decreasing) Exponential equations 500 follow the model y = a(b)x 300 (where a and b are constants) Population Rabbits 100 -100 0 2 4 Months 6 To determine if data is linear, quadratic or exponential › Create a Scatterplot of the data and look for the overall pattern › Evaluate the change in Y for each change in X IF y x = Constant = Increasing, 0, then Decreasing or Decreasing, 0, then Increasing = Increasing exponentially (e.g., doubles every time) or Decreases exponentially (e.g., halves every time) LINEAR QUADRATIC EXPONENTIAL Year (x) Widgets (y) 1850 34 1875 29 1900 25 1925 21 1950 16 1975 11 Time (x) Widgets (y) 0 0 1 10 2 14 3 13 4 9 5 6 Time (x) Widgets (y) 0 0 1 2 2 4 3 16 4 256 5 65,536 2000 6 The table below lists the total estimated numbers of AIDS cases, by year of diagnosis from 1999 to 2003 in the United States AIDS Notice the data peaks Year Cases in 2001, then drops off. 1999 41,356 This is a good indicator 2000 41,267 that Quadratic Regression 2001 40,833 will provide the most 2002 41,289 accurate model of the data 2003 43,171 (Source: US Dept. of Health and Human Services, Centers for Disease Control and Prevention, HIV/AIDS Surveillance, 2003.) 1). Plot the data, letting x = 0 correspond to the year 1998. 2). Find a quadratic function that models the data. • Using your calculator, enter the Year as L1 and #of Cases as L2 • Use the QuadReg function on your calculator to calculate the regression equation 3). Plot the function on the graph with the data and determine how well the graph fits the data, 4). Use the model (equation) to predict the cumulative number of AIDS cases for the year 2006. Year AIDS Cases 1999 41,356 2000 41,267 2001 40,833 2002 41,289 2003 43,171
