Systems of Inequalities
advertisement
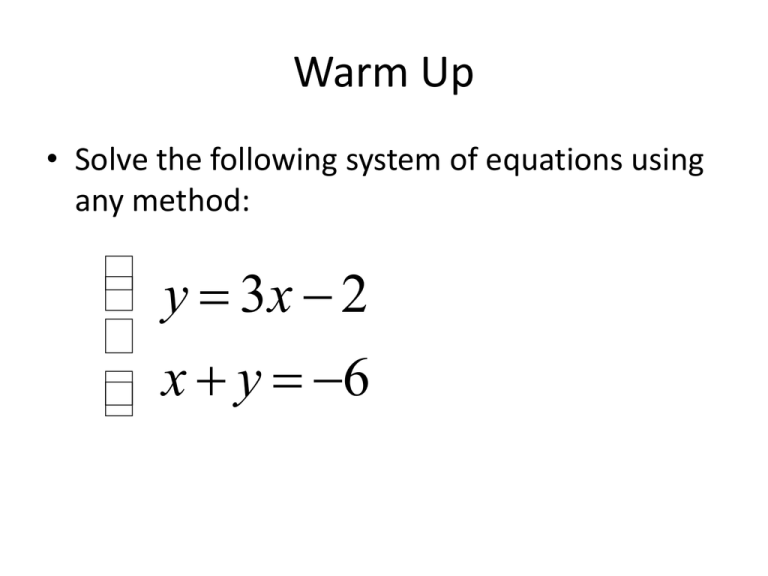
Warm Up • Solve the following system of equations using any method: ìï y = 3x - 2 í ïî x + y = -6 Word Problems • When working with system-of-equations word problems, determine the two equations that you can write. • Then solve using any method Example 1 • A test has twenty questions worth 100 points. The test consists of True/False questions worth 3 points each and multiple choice questions worth 11 points each. How many multiple choice questions are on the test? Example 2 • The senior classes at Knightdale High School and Enloe HS planned separate trips to New York City. The senior class at KHS rented and filled 1 van and 6 buses with 372 students. EHS rented and filled 4 vans and 12 buses with 780 students. Each van and each bus carried the same number of students. How many students can a van carry? How many students can a bus carry? Example 3 • Matt and Ming are selling fruit for a school fundraiser. Customers can buy small boxes of oranges and large boxes of oranges. Matt sold 3 small boxes of oranges and 14 large boxes of oranges for a total of $203. Ming sold 11 small boxes of oranges and 11 large boxes of oranges for a total of $220. Find the cost each of one small box of oranges and one large box of oranges. We show the solution to a linear inequality with a graph. Step 1) Put the inequalities into slopeintercept form. slope y = mx + b y-intercept Step 2) Graph the line a) If the inequality is < or >, make the lines dotted. b) If the inequality is < or >, make the lines solid. Step 3) Shade the correct region of the graph: a) Above the line for y > or y . b) Below the line for y < or y ≤. **This is because more then 1 ordered pair can be a solution! Examples: 1) y > -5x + 4 Examples: 2) x < 4 3) y ≥ -3 Examples: 4) 2x – 3y ≤ 6 Careful when you divide by a negative! Examples: 5) 3x + 2y < -2 We show the solution to a system of linear inequalities with a graph! Steps to Graphing a System of Inequalities: 1) Put the inequalities into slopeintercept form. 2) Decide if the lines should be dotted or solid. 3) Shade above for y > or y , shade below for y < or y ≤. 4) Shade the overlapping section darker to show where the solutions to both inequalities lie. Example #1: a: 3x + 4y > - 4 b: x + 2y < 2 Put in Slope-Intercept Form: Graph each line, make dotted or solid and shade the correct area. a : y 3 x 1 4 dotted shade above b : y 1 x 1 2 dotted shade below #2 Graph the system of linear inequalities. x –1 y>x–2 #3 x > -2 y<6 -2x + y > -5 Class Work • Graph the System of Inequalities on the handout Homework • HW 2.4

