Chapter 2
Profit’s Sensitivity to
Price
Conducting a Profit Sensitivity Analysis
to Identify volume Hurdles and the
Challenges Inherent in Economic Price
Optimization
Agenda
• How do price changes influence the ability to capture
customers?
• How sensitive are profits to price changes when we
include the influence of price changes to sales
volumes?
• When considering a price cut, what is the necessary
increase in sale volumes to improve the firm’s profits?
• When considering a price increase, what is the
allowable decrease in sale volumes that will leave the
firm more profitable?
• How does elasticity of demand enable executives to
optimize prices?
Profit Sensitivity Analysis
• If we know that the best price lies within a range, what
is the effect of a small change in price?
• Profit Equation
p = Q (P – V) – F
p – Profit
Q – Quantity Sold (Volume)
P – Price
V – Variable Costs
F – Fixed Costs
Profit Sensitivity Analysis
• Price Sensitivity Analysis analyzes the
sensitivity of profits to price changes
• Volume Hurdles are identified through the
profit sensitivity analysis. They define the
required changes in volume to justify a price
change.
Volume Hurdle
• Consider a Price Change
– How would volume need to change in order to improve profitability?
– Call this the Volume Hurdle
• Let the initial price and quantity be denoted by the subscript i, and the
final price and quantity be denoted by the subscript f
pi = Qi(Pi-V)-F
pf = Qf(Pf-V)-F
• Condition: any price change must improve profitability
pf > pi
• Use algebra to rearrange the equations and simplify to identify the volume
hurdle.
Volume Hurdle
%DQ ≥
– %DP
%CMi + %DP
Where
%DQ ≡
Qf – Qi
The change in volume must be
greater than this ratio for the
price change to yield higher
profits
Percent Change in Volume
Qi
%DP ≡
P f – Pi
Percent Change in Price
Pi
%CMi ≡
Pi – V i
Pi
Initial Contribution Margin as a
percentage of the original price
Example
• A retailer is selling T-shirt for $40 to his
customers which he purchase from the
wholesaler at a price of $30. Normally the
demand is 50 units per month. If the retailer
plans to increase the price by $50 per unit,
how much should be the allowable volume
drop?
Ans: -50%
Fixed Costs Don’t Matter, Variable Costs Do.
•
Notice Fixed Costs have no effect on
a marginal price change decision
– Your overhead is your problem, not
the customers. From a value
perspective, customers never care
about your cost structure. Only you
do. They only care about value –
how much value do they get for how
high a price.
– Fixed costs are key in the decision to
enter or stay in the industry. Once in
the industry, they make no difference
to marginal profitability decisions.
– Fixed costs more of an investment or
strategy issue than a pricing issue.
%DQ ≥
– %DP
%CMi + %DP
Volume Hurdle for a Price Cut
• Price cut, where %DP is negative, requires a
positive increase in volume to improve
profitability
– The amount of the required volume increase is
dependent on the size of the size of the
contribution margin.
– Large CM implies a small DQ is required.
– Small CM implies a larger DQ is required
• Strong implications with respect to tactical
price cuts
– Discounts
– Short term sales
– Creates a volume hurdle for the tactical price cut
to make sense to the firm
%DQ ≥
– %DP
%CMi + %DP
Volume Hurdle for a Price Hike
• Price Rise, where %DP is positive,
will allow for a reduction in
volume, up to a point.
– The amount of forfeited volume is
dependent on the contribution
margin.
– Small CM can handle a large DQ
decrease
– Large CM needs a smaller DQ
decrease
%DQ ≥
– %DP
%CMi + %DP
Profit Sensitivity towards Price Cuts
Retailer
Manufacturer
Broker
•
50% Contribution
Margin
•
25% Contribution
Margin
•
1% Contribution
Margin
•
15% Price Cut
•
5% Price Cut
•
0.1% Price Cut (10
bp)
•
43% Volume Growth
Required to Break
Even on the Decision
•
25% Volume Growth
Required to Break
Even on the Decision
•
11.1% Volume Growth
Required to Break
Even on the Decision
Profit Sensitivity towards Price Increases
Retailer
Manufacturer
Broker
•
50% Contribution
Margin
•
25% Contribution
Margin
•
1% Contribution
Margin
•
15% Price Rise
•
5% Price Rise
•
0.1% Price Rise (10
bp)
•
23% Volume Loss or
Less Decrease Would
Leave the Firm More
Profitable
•
14% Volume Loss or
Less Decrease Would
Leave the Firm More
Profitable
•
9.1% Volume Loss or
Less Decrease Would
Leave the Firm More
Profitable
Price Increases and Decreases have NonSymmetrical Effects on Profit
•
Price Cuts require Larger Changes in Volume than Price Rises to leave the firm equally
well off.
•
50% Contribution
Margin
•
50% Contribution
Margin
•
15% Price Rise
•
15% Price Cut
•
23% Volume Loss or
Less Decrease Would
Leave the Firm More
Profitable
•
43% Volume Growth
Required to Break
Even on the Decision
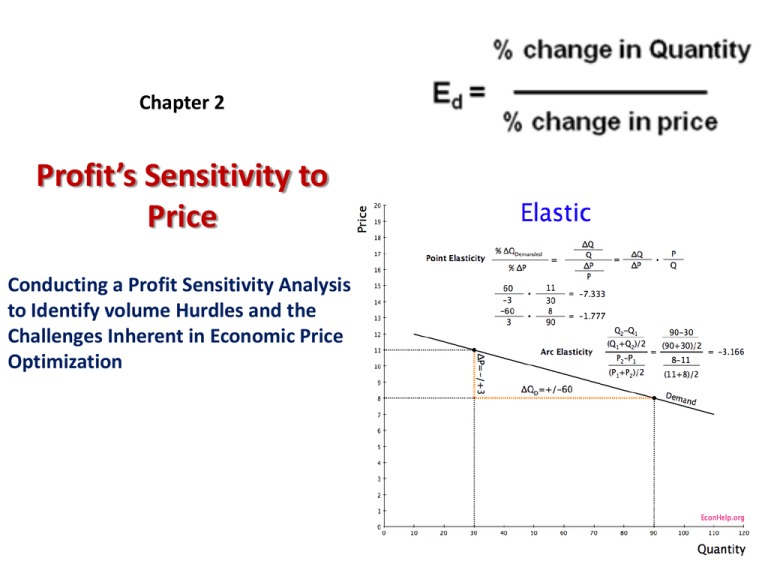
Price Elasticity of Demand
Price elasticity of demand measures the responsiveness of the quantity demanded
for a product or service to a change in the price of the product or service
Ed
Ed
ΔQ
ΔP
Q1, P1
(Q 1 Q 2) / Q 1
( P 1 P 2) / P 1
D Q / Q1
D P / P1
%DQ %DP
= price elasticity of demand
= quantity change in demand
= quantity change in demand
= original quantity demanded and price, respectively
Measured Elasticities
Category
Brand Choice
Category
Bacon
-1.25
-0.32
Margarine
-2.22
-0.12
Butter
-1.24
-0.74
Ice Cream
-1.89
-0.68
Paper Towels
-4.00
-0.74
Sugar
-4.03
-0.57
Liquid Detergents
-3.95
-1.70
Coffee
-1.65
-1.42
Soft Drinks
-2.66
-0.42
Bath Tissue
-3.85
-0.80
Potato Chips
-2.50
-0.88
Dryer Softeners
-4.08
-1.19
Yogurt
-1.57
-0.35
Highly Elastic Markets Favor Price Cuts
Elastic Demand Curve (e = -10) and
Volume Hurdle for Firm with a 25% Contribution Margin
15%
Percent Change in Price
Decreasing Profits 10%
5%
0%
Increasing Profits
-5%
-10%
-15%
-40%
-20%
0%
20%
40%
60%
80%
100%
120%
Percent Change in Volum e
• Elastic markets mean a small price change
induces a large volume change
– |e| > 1
– Most brands face elastic markets
© 2012 Cengage Learning. All Rights Reserved. May not be scanned, copied or duplicated, or posted to a publicly accessible website, in whole or
in part.
Inelastic Markets Favor Price Increase
Inelastic Demand Curve (e = -0.5) and
Volume Hurdle for Firm with a 25% Contribution Margin
Percent Change in Price
Increasing Profits 15%
10%
5%
0%
-5%
-10%
-15%
-40%
Decreasing Profits
-20%
0%
20%
40%
60%
80%
100%
120%
Percent Change in Volum e
• Inelastic markets mean that a large price change is required to induce
a noticeable volume change
– |e| < 1
– Many industries face inelastic markets
© 2012 Cengage Learning. All Rights Reserved. May not be scanned, copied or duplicated, or posted to a publicly accessible website, in whole or
in part.
Other elasticities in Pricing
• Income elasticity of demand
• Cross price elasticity of demand
Income Elasticity of Demand
• Income elasticity of demand: responsiveness of the quantity demanded
of a product or service to a change in personal income
EI
(D Q)
DI
(I)
Q
• If EI is negative, the product is an inferior good
Income goes up fewer units are demanded (switch to steak, less hamburger)
• If EI is positive, the product is a normal good
Demand increases as income increases
• If 0<EI<1, the product becomes less important in households’ consumption plan
• If EI >1, the product becomes more important as income increases.
Cross-Price Elasticity of Demand
• Cross price elasticity of demand: responsiveness of demand for a
product to a change in the price of another product
Ec
DQA
D PB
PB
QA
• If EC is negative, the two products are complementary
• If EC is positive, the two products are substitutes
Price Optimization
•
The above analysis implies that optimal pricing can be found, one where in
increase or decrease in price leads to less profit than otherwise would be
found.
– Assuming a constant elasticity of demand over a wide range of price, through
integral calculus we find the Optimal Price for elastic markets at:
Ve
P
1 e
– At the optimal price, the quantity sold is
e
P
Q Q i
Pi
– Where Qi and Pi the current demand and price
Optimal Price
Measure
Variable Cost
V
$5
Fixed Cost
F
$750,000
Elasticity of Demand
e
-1.8
Demand at $1
Qo
10,000,000
P*
$11.25
Under the conditions, find
Optimal Price
Key Challenge of Price Optimization
What is the relevant Elasticity of Demand?
• Always a “historic” number, not forward looking number.
– Dependent upon the economic conditions, competing alternatives, tastes of the
market, and other market factors, all of which are constantly changing.
– Can be influenced by the firm’s actions: Branding enables higher prices,
discounting can reset price expectations lower lowering the potential price
capture
• Non-measurable for revolutionary products
• Small versus large price changes may exhibit different a elasticity
• Upward versus downward price changes may exhibit different a elasticity
Summary
• A Profit Sensitivity Analysis should be used to identify Volume Hurdles
for tactical pricing actions (Discounts, Price Promotions, Specific Sales
Opportunities)
• Profit is asymmetrically sensitive to price cuts vs. price hikes
• Inelastic markets favor price increases
• Elastic Markets favor price decreases
• Given the elasticity of demand, one could identify “optimal prices”


