Syllabus 1.5.3:
advertisement
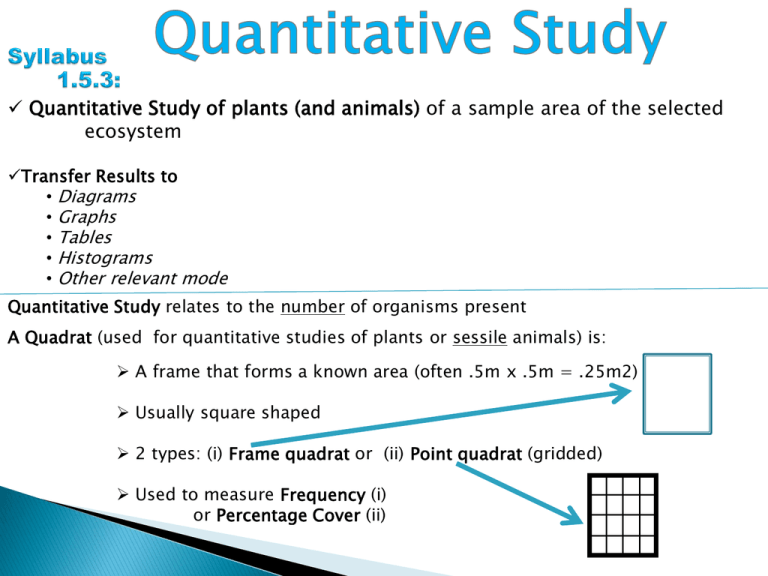
Quantitative Study of plants (and animals) of a sample area of the selected ecosystem Transfer Results to • Diagrams • Graphs • Tables • Histograms • Other relevant mode Quantitative Study relates to the number of organisms present A Quadrat (used for quantitative studies of plants or sessile animals) is: A frame that forms a known area (often .5m x .5m = .25m2) Usually square shaped 2 types: (i) Frame quadrat or (ii) Point quadrat (gridded) Used to measure Frequency (i) or Percentage Cover (ii) Using a FRAME quadrat Using a POINT quadrat Percentage Cover = the area of ground occupied by aerial parts of a named plant within the sample area (expressed as a percentage of the total area) – used for ‘cover plants e.g. grass Frequency = The chance of finding a named organism within the sample area 1. Throw the frame quadrat (size must match survey area for accuracy) randomly in the 1. sample area (safely? how? ) 2. for accuracy) randomly Record the presence or absence of the named organism within each quadrat 3. Repeat for a number of throws (size must match survey area in the sample area (safely? how?) 2. Lower the needle at each of the 25 sampling point s - i.e. where wires cross (more throws, more accuracy) 4. Throw the point quadrat 3. Record the number of hits at the sampling points – i.e. if plant touches the needle at one Tabulate results of the 25 cross points that represents 4% cover 5. Calculate using formula below: (can be converted to a percentage by multiplying (so multiply ‘hits’ by 4) 4. by 100) No. of quadratswith org. present Frequency No. of quadratsthrown Repeat for a number of throws accuracy) to (more throws, more get the average 5. Tabulate results 6. Calculate average percentage cover Frequency table Organism 1 2 3 4 Frequency 5 Quadrat throw 6 7 8 9 10 Total Frequency % Frequency No. of quadratscontainingorganism No. of quadratsthrown If percentage is required multiply frequency by 100 Chart/Graph of Frequency % Frequency 60% 50% 40% % Frequency 30% % Frequency 20% 10% 0% Buttercup Daisy Dandelion Plant name Grass Quadrat throw Plant Name Grass 1 2 3 4 5 6 7 8 9 Total no. 10 of Hits Total Points % Cover 250 250 % Cover No. of hits 100 Τotal no. of point s Pie Chart of Percentage Cover Percentage (ground) Cover Creeping buttercup others 10% 5% Grass 85%
