Research in Psychology: Methods & Design
advertisement
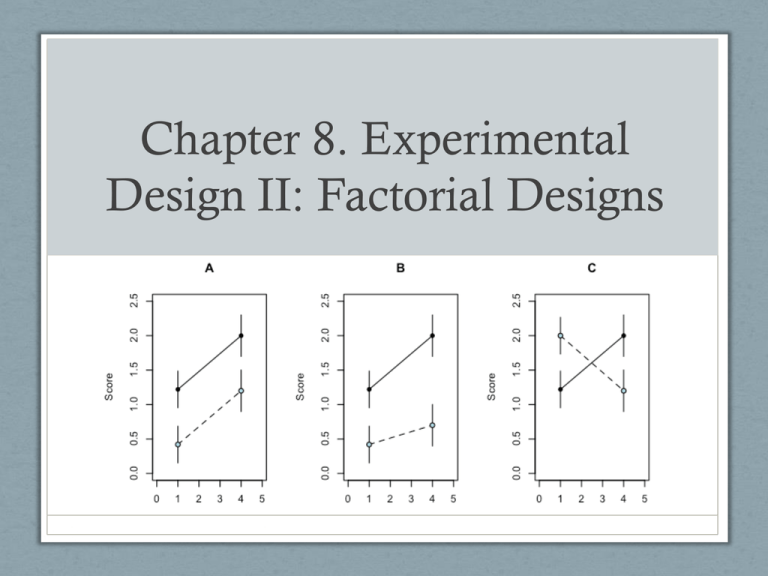
Chapter 8. Experimental Design II: Factorial Designs Chapter 8. Experimental Design II: Factorial Designs Chapter Objectives • Describe factorial designs using a standardized notation system (2x2, 3x5, etc.) and place data accurately into a factorial matrix to calculate row and column means • Understand what is meant by a main, interaction effect and know how to determine if one exists Identify the varieties of factorials that correspond to the single-factor designs of Chapter 7 Chapter Objectives • Identify a mixed factorial design and a PxE factorial Calculate the number of participants needed to complete each type of factorial design Construct an ANOVA source table for an independent groups factorial design Factorial Essentials • Factorial design = more than one IV • IVs referred to as “factors” • Identifying factorial designs • Notation system • Digits represent IVs • Numerical values of digits represent the # of levels of each IV • 2x3 factorial (say: “two by three”) • 2 IVs, one with 2 levels, one with 3 = 6 total conditions • 2x4x4 factorial • 3 IVs, with 2, 4, and 4 levels = 32 total conditions Factorial Essentials • Identifying factorial designs • Factorial matrix • 2x2 (two levels each of type of training and presentation rate) Outcomes—Main Effects and Interactions • Main Effects • Overall effect of IV “type of training” • Main effect compares data in both light-shaded cells (imagery) with data in both dark-shaded cells (rote) • Main effect compares row means (imagery vs. rote) Outcomes—Main Effects and Interactions • Main Effects • Overall effect of IV “presentation rate” • Main effect of compares data in both light-shaded cells (2-sec rate) with data in both dark-shaded cells (4-sec rate) • Main effect compares column means (2-sec vs. 4-sec) Outcomes—Main Effects and Interactions • Main Effects • Calculations row and column means • For hypothetical data: • Row mean #1 (imagery) = 20 • Row mean #2 (rote) = 15 • Column mean #1 (2-sec) = 14.5 • Column mean #2 (4-sec) = 20.5 Outcomes—Main Effects and Interactions • Main Effects • For hypothetical data: • Main effect for type of training • Imagery (M = 20) produces better recall than rote (M = 15) • Main effect for presentation rate • 4-sec rate produces better recall (M = 20.5) than 2-sec rate (M = 14.5) Outcomes—Main Effects and Interactions • Interactions • effect of one factor depends on the level of the other factor, can be described two ways IVs course emphasis and student major • No main effects (row and column means all equal 75) Outcomes—Main Effects and Interactions • Interactions • Whether lab or lecture emphasis is better depends on which major is being evaluated • Lab emphasis science majors do better (80>70) • Lecture emphasis humanities majors do better (80>70) Outcomes—Main Effects and Interactions • Interactions • Whether science or humanities majors do better depends on what type of course emphasis there is • Science majors better with lab emphasis (80>70) • Humanities majors better with lecture emphasis (80>70) Outcomes—Main Effects and Interactions • Interactions • Research example 18: Studying in noise or silence • IVs study conditions (silent or noisy) and test conditions (silent or noisy) • No main effects, but an interaction • Best memory when study and test conditions match Outcomes—Main Effects and Interactions • Interactions can trump main effects • Caffeine, aging, and memory study • Two main effects – neither relevant Outcomes—Main Effects and Interactions • Combinations of main effects and interactions • Main effect for imagery instructions (22>14), no main effect for presentation rate, no interaction Outcomes—Main Effects and Interactions • Combinations of main effects and interactions • No main effect for imagery instructions, a main effect for presentation rate (22>14), no interaction Outcomes—Main Effects and Interactions • Combinations of main effects and interactions • Main effect for imagery instructions (20>16) and presentation rate (20>16), no interaction Outcomes—Main Effects and Interactions • Combinations of main effects and interactions • Interaction and two main effects Outcomes—Main Effects and Interactions • Combinations of main effects and interactions • Interaction and two main effects Outcomes—Main Effects and Interactions • Combinations of main effects and interactions • Line graphs occasionally used to highlight interactions (nonparallel lines indicate interaction) Varieties of Factorial Designs Varieties of Factorial Designs • Mixed factorial designs • At least one IV is a between-subjects factor • At least one IV is a within-subjects factor Pre-Proactiv New Old Post-Proactiv 12 4 14 11 Varieties of Factorial Designs • Factorials with subject and manipulated variables : P x E designs • P = person factor (a subject variable) • E = environmental factor (a manipulated variable) • If E is a repeated measure mixed P x E factorial • Main effect for P factor • Introverts outperform extroverts, regardless of room size Varieties of Factorial Designs • Factorials with subject and manipulated variables : P x E designs • Main effect for P factor • Introverts outperform extroverts, regardless of room size Varieties of Factorial Designs • Factorials with subject and manipulated variables : P x E designs • Main effect for E factor • Performance worse in small room, regardless of personality Varieties of Factorial Designs • Factorials with subject and manipulated variables : P x E designs • P x E interaction • Introverts do better in large room, while extroverts do better in small room Summary • Factorial designs allow us to evaluate the effects of multiple IVs on the DV or DVs. • There are different types of factorial designs, depending on how you manipulate your IVs. • Between-subjects, repeated measures, mixed, PxE • Main effects of each IV and interactions among IVs are the results from factorial designs. • Factorial ANOVAs are the statistical tests used. • With the experimental design tools at your disposal, remember to be an ethical researcher.


