DCP ET50 graphs and explanation
advertisement
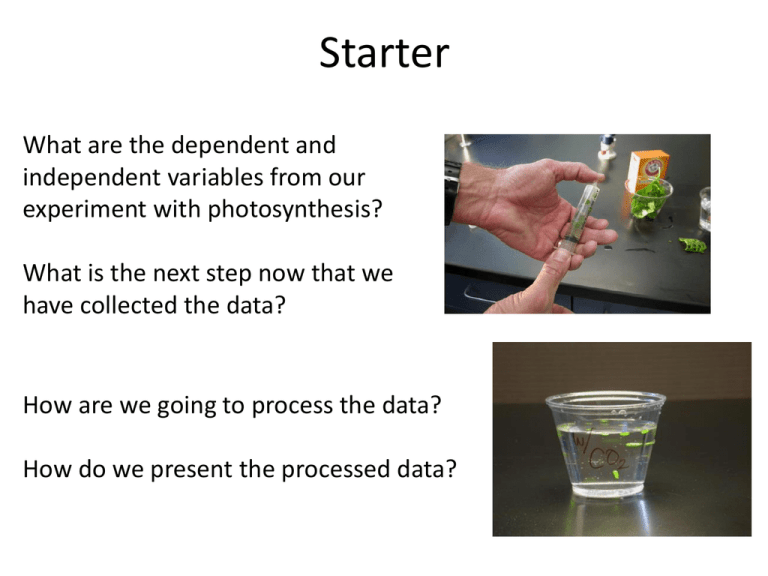
Starter What are the dependent and independent variables from our experiment with photosynthesis? What is the next step now that we have collected the data? How are we going to process the data? How do we present the processed data? Outcomes – Data processing You should all be able to: • Calculate the mean from the results collected. • Construct graphs of the mean number of leaves floating vs. time. • Identify the time at which half of the leaves were floating: the “ET50” for each concentration. Look at the results we have… 1. How many repeats are there? 2. What still needs to be calculated? 3. How are you going to calculate it? Step 1 - we need to calculate the mean number of leaves floating per minute. • Now that you have the mean, let’s graph the results. • What type of graph do we need? Why? • NOTE: these are not the final graphs but we need them to calculate the rate of photosynthesis. ET50 Step 2 – Calculate the ET50 using our graphs of the results… The point at which 50% of the leaf disks are floating (the median) is the point of reference for this procedure and is known as ET50. Using your graph, estimate the time at which 50% of the disks are floating. What are our ET50 values? Step 3 – put our ET50 values into a table. Sodium bicarbonate concentration (mol/dm3) ET50 (min) 0.3 10 0.6 7 0.9 8 1.2 8 1.5 5 How do we interpret ET50? • In a low concentration of sodium bicarbonate photosynthesis would proceed at a relatively slow rate. We would expect the rate of oxygen produced to be low, and the time at which 50% of the disks are floating to be relatively long. • In a high concentration of sodium bicarbonate, photosynthesis would proceed more rapidly. We would expect the rate of oxygen produced to be high and the time at which 50% of the disks are floating to be comparatively short. How do we interpret ET50? We can conclude that the ET50 statistic is indirectly proportional to the rate of photosynthesis, the higher the rate of photosynthesis, the smaller the ET50 statistic. Concentration of sodium bicarbonate 0.3 0.6 0.9 1.2 1.5 Concentration of sodium bicarbonate (mol/dm3) How do we interpret ET50? To correct for this representation of the data and present a graph that shows increasing rates of photosynthesis with a positive slope the ET50 term can be modified by taking the inverse or 1/ET50. This creates a graph like this (data from Steucek, et al. 1985.): Concentration of sodium bicarbonate 0.3 0.6 0.9 1.2 1.5 Concentration of sodium bicarbonate (mol/dm3) What are our 1/ET50 values? Step 4 – We need to calculate the 1/ET50 in order to get the rate of photosynthesis Sodium bicarbonate concentration (mol/dm3) Rate of photosynthesis 1/ET50 0.3 0.10 0.6 0.14 0.9 0.13 1.2 0.13 1.5 0.20 Now we need to present our processed data… Step 5 – we need to graph our final results What type of graph will we use? Why? To Excel! What do we need to include in the write-up when presenting our tables and graphs?
